Does Copilot for Power BI really transform data analysis in Power BI? We analyze the real impact of Copilot in Power BI.
The world of data analytics is advancing at an extraordinary pace, and Microsoft is at the forefront of this evolution with the introduction of Copilot in Power BI. This groundbreaking feature is transforming how organizations engage with data, making sophisticated analytics accessible to all through the power of generative AI.
Copilot brings a new level of intelligence (artificial but still intelligent) to Power BI, enabling users to interact with data in natural language. From creating detailed reports to performing complex calculations and generating narrative insights, Copilot simplifies traditionally time-consuming tasks, empowering users across all levels of technical expertise.
In this blog, we’ll take a closer look at what Copilot for Power BI offers, its core benefits, and how it’s reshaping the way businesses approach data analytics.
What is Copilot for Power BI?
Copilot is a GenAI feature integrated into Microsoft’s Power Platform, seamlessly enhancing the Power BI experience. Acting as a virtual assistant, Copilot understands and responds to natural language commands, eliminating the need for technical jargon or advanced training. Users simply describe their requirements, and Copilot delivers actionable results.
For instance, a user could ask, “Show me last quarter’s sales broken down by region.” In response, Copilot generates a fully visualized report, complete with charts and tables, drawing directly from the organization’s data.
This functionality represents a significant advance, as it allows less technical users in a company to create their own reports. However, it is important that users follow certain design criteria when creating their Power BI reports with Copilot. The best way to unify the design and look and feel of all corporate reports, whether created by Copilot or not, is through the creation of Power BI themes.
Ebook: ¿How to create Power BI themes?
Download this e-book where we explain step by step how to create themes in Power BI.
The essence of Copilot for Power BI lies in its focus on accessibility and usability. By removing barriers to data analysis, Copilot empowers organizations to harness the full potential of their data, making informed, strategic decisions.
As part of Microsoft’s portfolio, alongside tools like ChatGPT and Gemini AI, Copilot has quickly established itself as a leader in the GenAI market.
Copilot for Power BI: Automating Reporting?
Since the release of Microsoft Copilot for Power BI, there has been increasing discussion about automating reporting and data analysis.
Indeed, Copilot is a tool that greatly simplifies report creation by generating reports based on simple prompts expressed in natural language. This functionality is particularly useful for managers and mid-level professionals who need to view and analyze reports on specific business areas.
However, Copilot is not a magic solution. As always, its effectiveness depends on a solid foundation to work on.
Copilot for Power BI: The Dataset is Key
The success of any report created with Copilot is directly tied to the quality of the underlying dataset. For Copilot to perform at its best and deliver on its promise, a well-constructed dataset with a solid architecture is essential.
Why is the Dataset So Important?
The dataset is the foundation on which Copilot operates. If the data is not logically structured, incomplete, or lacks a well-designed architecture, Copilot will struggle to generate useful reports or extract valuable insights. In other words, Copilot is only as good as the data it receives.
A well-constructed dataset ensures that:
- Data is consistent and relevant.
- Relationships between tables and fields are clear and well-defined.
- The data architecture is efficient, enabling seamless access and analysis.
Without this solid foundation, even an advanced tool like Copilot will have limited capabilities.
Building Robust Datasets: How Bismart Can Help
At Bismart, we specialize in designing datasets with a robust architecture that allows tools like Copilot to perform at their best. Our approach includes:
- Logical Data Design: We structure information clearly and coherently.
- Architecture Optimization: Ensuring data is accessible and easy to analyze.
- Analysis-Ready Preparation: Creating datasets primed for generating insights and visualizations with minimal friction.
The Importance of Consistent Design in Copilot-Created Reports
Copilot for Power BI is an extremely useful tool for quickly generating reports. However, it is important to note that reports created by Copilot tend to be generic in design. This may be a drawback for organizations that aim to maintain a consistent visual identity across all reports.
Why is Consistent Design Important?
In an organization, visual consistency in reports not only reinforces brand identity but also improves data comprehension and analysis. Uniform design in terms of colors, typography, and visual styles ensures that both internal and external users can recognize reports as part of the same organization, while also projecting professionalism and credibility.
Ensuring Consistency with Power BI Themes
To maintain this uniformity, it is essential to use customized themes in Power BI. Themes allow organizations to set a predefined palette of colors, styles, and fonts that automatically apply to all reports, including those generated with Copilot. This enables users to:
- Automate Design: Apply themes to any report, regardless of its creator.
- Ensure Uniformity: All reports will follow the same look and feel, aligned with the organization’s visual identity.
- Simplify Editing: Even automatically generated reports can be adjusted to the desired design with a single click.
Ebook: ¿How to create Power BI themes?
Download this e-book where we explain step by step how to create themes in Power BI.
Copilot Simplifies but Doesn’t Replace
While Copilot helps you quickly create reports, it remains a tool that requires well-prepared data to function effectively. For this reason, investing time in data preparation and optimization is essential before leveraging this technology.
Need to ensure your data is ready to shine with Copilot? At Bismart, we’re here to help.
Looking to maximize Copilot’s potential? We’ve got you covered!
Microsoft Fabric: The Foundation for Copilot in Power BI
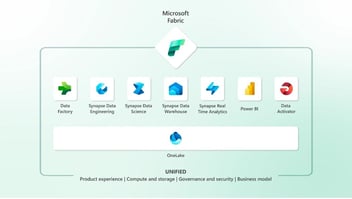
To understand Copilot’s full potential, it’s important to place it within the context of Microsoft Fabric. Fabric is an all-in-one platform designed to streamline data management and analytics at scale.
By integrating services like Power BI, Azure Data Factory, and Synapse into a unified ecosystem, Fabric enables organizations to work with data more efficiently and collaboratively.
Copilot for Power BI is a standout feature within Microsoft Fabric, leveraging the platform’s unified data model to ensure consistent and accurate analytics. Its natural language capabilities simplify complex workflows, allowing teams across departments to access insights without technical bottlenecks.
Together, Copilot and Fabric create a seamless environment where data-driven insights are just a query away.
New Licensing with Microsoft Fabric
The launch of Microsoft Fabric also brings changes to Power BI’s licensing model. Several existing licenses have been replaced with new options designed to align with Fabric’s holistic approach. These changes provide users with access to a broader range of tools and capabilities under a simplified licensing framework.
The transition to Microsoft Fabric is here for Power BI users:
Organizations currently using Power BI, particularly those on Premium capacity licenses, should prepare for the transition to Microsoft Fabric by January 1, 2025. Proactively adapting to this new ecosystem ensures uninterrupted access to the latest tools and features, maintaining your organization’s competitive edge.
👉 Contact us today to review your current setup and ensure a smooth, efficient transition to Microsoft Fabric.
Start your transition to Microsoft Fabric today
Features of Copilot in Power BI
1. Interaction in Natural Language
One of Copilot's most revolutionary features is its ability to respond to natural language requests.
Users can ask questions such as: "How did sales perform by region last quarter?" and Copilot automatically generates relevant charts and tables, leveraging Microsoft Fabric's natural language processing (NLP) capabilities.
2. Simplified DAX Calculations
DAX (Data Analysis Expressions) is a fundamental programming language when using Power BI but can be challenging for many users.
Copilot removes these barriers by generating DAX expressions based on simple descriptions, such as: "Calculate the percentage growth in sales compared to last year."
3. AI-Generated Narratives
In addition to charts and tables, Copilot provides narrative summaries that explain key trends, anomalies, and patterns in the data. This functionality is particularly useful for presentations to executives and non-technical stakeholders.
4. Report Creation Automation
Copilot can automate the selection of Power BI visuals, measures, and relevant data, significantly streamlining the report design process.
This allows data analysts to focus on strategic analysis, leaving repetitive tasks to AI.
5. Seamless Integration with Microsoft's Ecosystem
As part of Microsoft Fabric, Copilot integrates effortlessly with other Microsoft services such as Azure Data Factory, Dynamics 365, and Microsoft Teams.
This ensures efficient data flow across platforms, enhancing collaboration and information consistency.
Advantages of Copilot for Power BI Users
1. Democratization of Data Analysis
The combination of Copilot and Power BI removes technical barriers, enabling anyone in an organization, regardless of their technical expertise, to access and analyze data.
This fosters faster, data-driven decision-making at all levels.
2. Reduced Development Time
Copilot streamlines tasks that previously required hours or even days, such as dashboard creation and the design of complex calculations. This frees up analysts to focus on high-impact strategic initiatives
3. Improved Accuracy in Analysis
By operating on Microsoft Fabric's unified data model, Copilot ensures the data used for analysis and reporting is consistent and accurate, minimizing errors and redundancies.
4. Increased Productivity
Automating repetitive tasks not only enhances efficiency but also reduces the workload for analytics teams, allowing them to focus on more critical activities.
5. Educational Potential
For less experienced users, Copilot serves as a learning resource, providing examples and guidance on how to use Power BI more effectively.
How to Implement Copilot in Power BI
To maximize Copilot’s potential, consider these key recommendations:
-
Enable Copilot in Microsoft Fabric:
Copilot’s functionality is integrated within Fabric, so organizations must ensure this platform is enabled in their environment. -
Optimize the Data Model:
A clean, well-structured data model facilitates the generation of accurate insights. Data quality is essential to unlock Copilot’s full value. -
Train Users:
While Copilot is intuitive, providing basic training on how to interact with the tool can increase adoption and effectiveness. -
Integrate Relevant Data Sources:
To gain maximum value, connect your organization’s most important data sources, leveraging Microsoft Fabric’s integration capabilities.
The Future of Copilot in Power BI
The integration of Copilot and Microsoft Fabric unlocks endless possibilities for data analysis. As generative AI evolves, we can anticipate advancements in predictive capabilities, personalized reporting, and deeper integration with tools across the Microsoft ecosystem.
Microsoft is committed to making data analysis accessible, collaborative, and strategic. Copilot is not just a tool for the present but a gateway to the future of data analysis.
Ebook: ¿How to create Power BI themes?
Download this e-book where we explain step by step how to create themes in Power BI.
Conclusion
Copilot for Power BI, as part of Microsoft Fabric, can help accelerate how organizations analyze and visualize data thanks to its ability to create reports from simple prompts in natural language. This functionality is particularly useful for managers and mid-level professionals who need to quickly and easily access specific business area reports.
However, it is important to note that Copilot is not a magic solution. Its effectiveness directly depends on the quality of the underlying dataset.
For Copilot to reach its full potential and deliver accurate results, it is essential to have a well-structured dataset supported by a solid architecture. In this sense, it serves as a key tool to streamline processes and promote a data-driven culture, as long as it relies on a reliable data foundation..


