At Bismart we not only add technical talent, but when it comes to designing reports and dashboards we apply communication and usability knowledge.
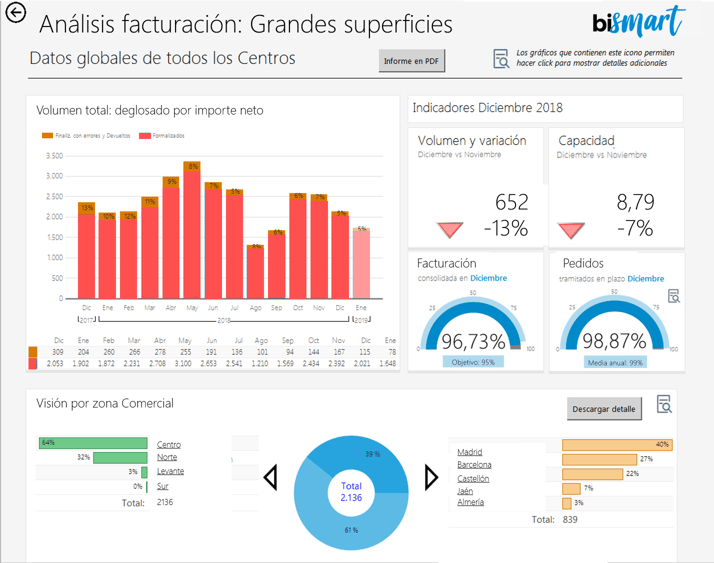
Who said that highly visual and interactive reports, dashboards were not possible with Microsoft SQL Server Reporting Services?
At Bismart we not only add technical talent, but when it comes to producing reports and dashboards we apply communication and usability knowledge to design them.
We take into account factors such as:
- The audience that will receive each report, adapting the information (detail and visualization) to each one of them,
- we follow patterns of reading coherence
- look for a common thread through all the tabs of a report or parts of a dashboard,
- look for an internal concordance of each report or scorecard, grouping by families the dimensions and indicators that are related,
- and give a chromatic sense to the report helped with the templates of corporative colors.
These factors are taken into consideration regardless of the technology, be it Reporting Services or Power BI or even with other tools. Our team of experts have a large experience working with tools like Power BI and they make an effort to ensure they reach the best solutions for our clients. In fact, Bismart is one of the few companies in Spain that has the honor to be Microsoft's partner Power BI and we have been using this tool since it was launched in 2015.
The standard reports made with Reporting Services present, in most cases, many lines of improvement in terms of visual design and usability to provide an adequate response to user expectations.
In addition, these reports can be printed in A4 format or sent by email automatically so that they can be presented as executive summaries in the Boards or Management Committees.
Thanks to the skills of Bismart's professional team, we are able to make the most of Reporting Services by creating dashboard reports with different visual objects, powerful navigation, ordering and interaction functionalities.

- The 8 Best Text Analytics Systems
- How Condé Nast Improved Their Processes by Using a Simple but Powerful BI Tool (Case Study)


