We explore the differences between a Power BI Dashboard vs Report. How are they different? Learn the difference between them.
Within the Power BI ecosystem, two fundamental components play pivotal roles in transforming data into knowledge: dashboards and reports. These tools serve distinct purposes in the data analytics journey, each contributing uniquely to the process. However, even if similar, Power BI dashboards and reports serve different purposes. Let's explore them.

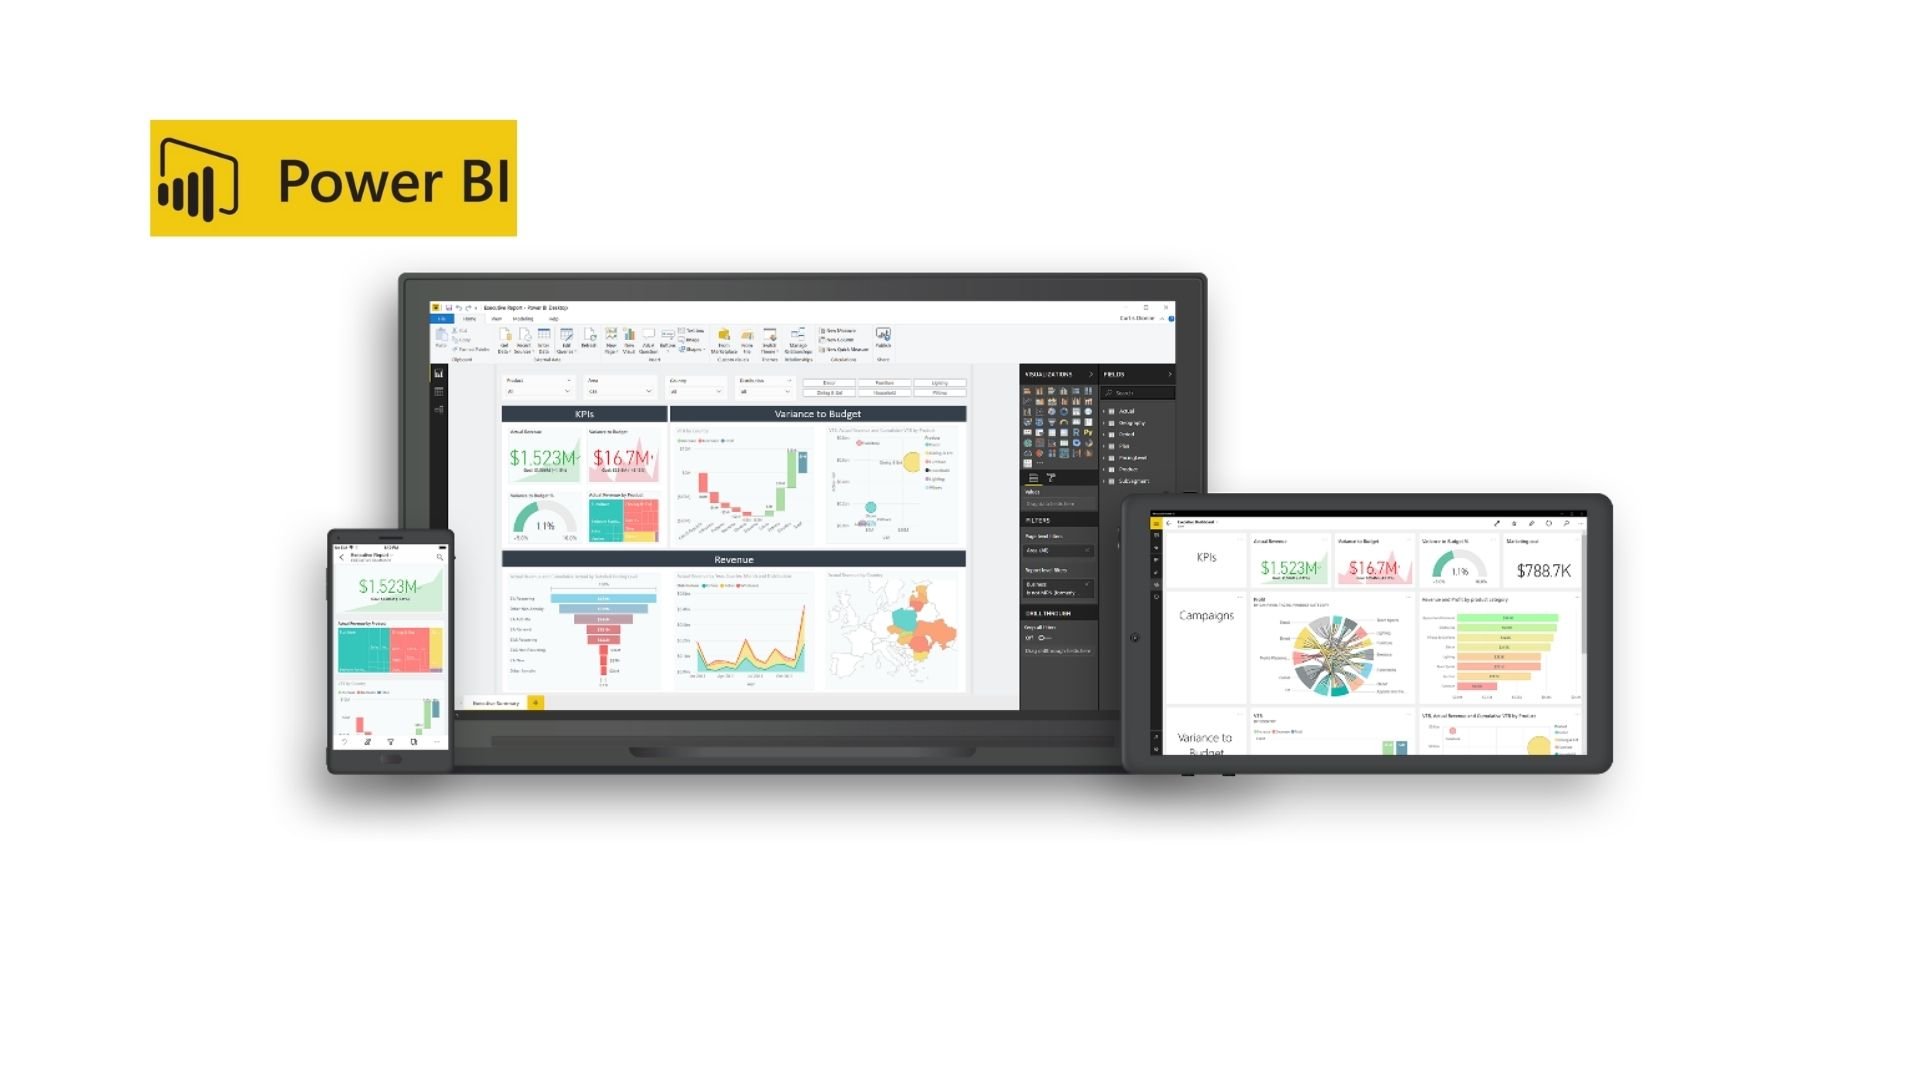
In today's data-driven world, businesses are increasingly relying on powerful data analytics tools to turn raw data into actionable insights. Microsoft's Power BI has emerged as the frontrunner in this field, offering robust capabilities for data visualization and analysis.
At the core of this transformative technology lie two key components: dashboards and reports. Each serves as a distinct powerhouse for extracting insights from data, offering businesses a dynamic duo that can uncover trends, illuminate patterns, and ultimately, make data-driven decisions and drive informed actions.
If you are interested in making the most of your data through data visualization, don't miss our e-book with the 15 best Power BI dashboards of 2023!

Even though Power BI dashboards and reports are similar, they are not the same. In fact, they play complementary roles in the journey from data to intelligence.
In this article, we will delve into the world of Power BI dashboards and reports, exploring their differences, applications, and how they collectively empower organizations to harness the full potential of their data.
Understanding the differences between Power BI dashboards and reports is essential for the creation of an optimal data-driven strategy, as well as for unlocking actionable insights and making better decisions by leveraging data.
What is the difference between a dashboard and a report?
A dashboard provides a concise, high-level overview of key performance indicators (KPIs) and critical data in a visually appealing format, often with limited interactivity. In contrast, a report offers more detailed and comprehensive information, typically presented in a structured document or format with more extensive data exploration and analysis capabilities.
What is the difference between a dashboard and a report in terms of information?
A dashboard typically provides a summarized view of essential information through visualizations and widgets, offering a quick and easily digestible glance at key performance indicators (KPIs) and critical data. It emphasizes a high-level overview.
A report, on the other hand, offers a more detailed and extensive presentation of information. It includes more in-depth data analysis, explanations, and often contains textual descriptions, tables, and charts that provide a thorough understanding of a particular topic or dataset.
In summary, the key distinction in terms of information is that a dashboard offers concise, summarized data, while a report offers detailed and extensive information.
What is the difference between a dashboard and a report in terms of design?
In terms of design, dashboards typically feature a visually appealing and concise layout. They prioritize the use of visualizations, charts, graphs, and widgets to represent data. Dashboards aim for simplicity and provide a quick, high-level view of key metrics. They are often designed to be interactive, allowing users to explore data by filtering or drilling down into details.
On the other hand, Power BI reports are more detailed and comprehensive in design. They may contain multiple pages or sections, each with various visual elements, tables, text descriptions, and detailed analysis. Reports tend to be less visually focused and more content-oriented. They are designed for presenting in-depth information and insights, making them suitable for in-depth analysis.
In short, dashboards prioritize visual simplicity and interactivity, while reports offer a more content-rich and detailed design.
What is a Power BI report?
A Power BI report is a data visualization and business intelligence tool created using Microsoft's Power BI platform. It is a digital document that presents data, information, and insights in a visually appealing and interactive format. Power BI reports are typically used for data analysis, decision-making, and sharing information within an organization.
Key characteristics of a Power BI report include:
-
Data Visualizations: Power BI reports consist of various data visualizations such as charts, graphs, tables, maps, and other interactive elements. These visualizations help users understand data patterns, trends, and relationships.
-
Interactivity: Users can interact with a Power BI report by clicking on elements, filtering data, or drilling down into specific details. This interactivity allows for a dynamic exploration of data.
-
Data Sources: Power BI reports are connected to data sources, which can include databases, spreadsheets, cloud services, and more. Data is imported or queried from these sources to create the visualizations.
-
Data Transformations: Users can perform data transformations within Power BI to clean, reshape, and model the data for better analysis. Power Query and Power Pivot are tools commonly used for data preparation.
-
Report Pages: A Power BI report can have multiple pages or tabs, each containing a different set of visualizations or analysis. Users can navigate between these pages to explore different aspects of the data.
-
Filters and Slicers: Reports often include filters and slicers that allow users to control what data is displayed. Filters can be applied to specific visualizations or the entire report.
-
Custom Calculations and Measures: Users can create custom calculations and measures using DAX (Data Analysis Expressions) to derive additional insights from the data.
-
Sharing and Collaboration: Power BI reports can be published to the Power BI service or shared with others within an organization. Users can collaborate on reports, view them in web browsers or mobile apps, and set up automatic data refresh.
Power BI reports are valuable tools for businesses and analysts to gain insights from data, monitor key performance indicators, and make data-driven decisions. They are part of the broader Power BI ecosystem, which also includes dashboards, datasets, and Power BI Desktop for report creation.
What is a power BI Dashboard?
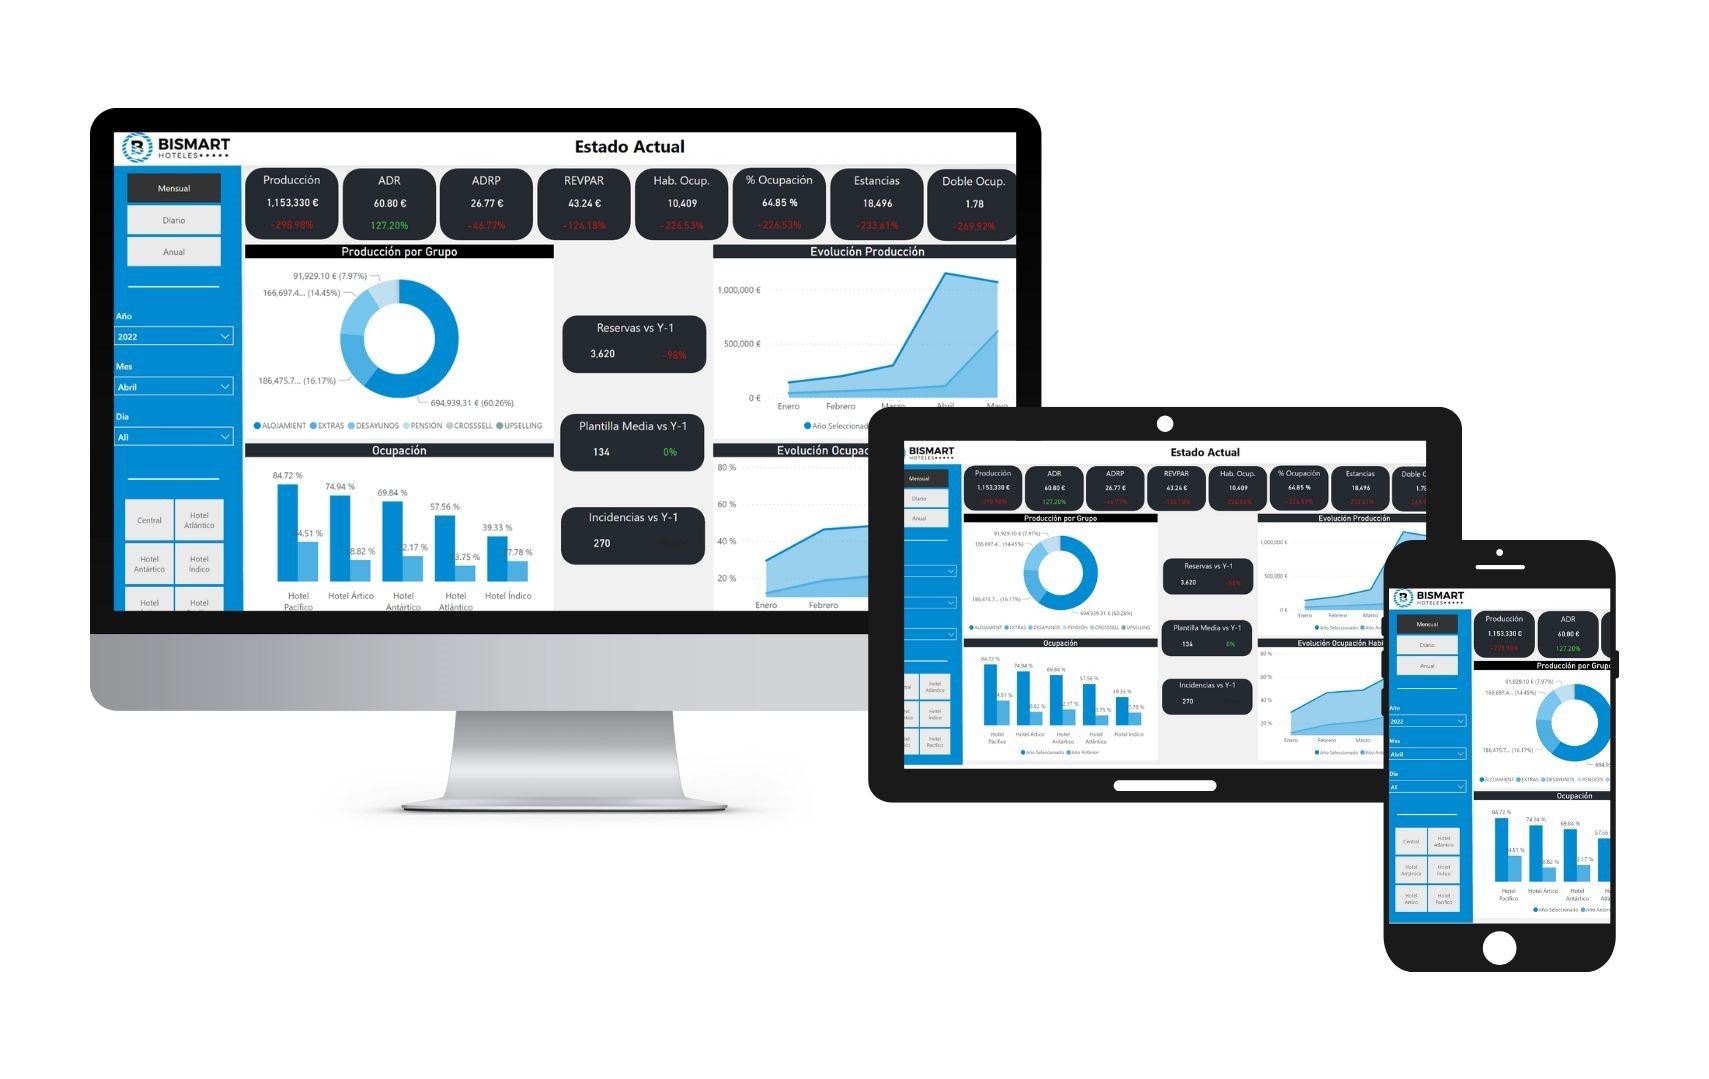
Source: Bismart's Hotel Management Dashboards
A Power BI dashboard is a data visualization tool and interactive canvas within the Microsoft Power BI platform. It is designed to provide a consolidated and at-a-glance view of key performance indicators (KPIs) and critical data points from various sources in a single, visually appealing interface. Power BI dashboards are highly customizable and allow users to monitor, analyze, and share data insights in real-time.
Key characteristics of Power BI dashboards include:
-
Data Visualizations: Dashboards contain data visualizations, such as charts, graphs, gauges, tiles, and maps, that display important metrics and trends. These visualizations are often designed to be concise and easy to understand at a glance.
-
Aggregation: Dashboards aggregate data from multiple reports, datasets, or data sources. They provide a high-level summary of data, making it convenient for decision-makers to monitor the overall health of a business or specific areas of interest.
-
Real-Time Updates: Power BI dashboards can be set up to display real-time or near-real-time data, ensuring that users have access to the latest information. This is particularly useful for tracking dynamic metrics or changing conditions.
-
Interactivity: Users can interact with dashboards by clicking on visuals, applying filters, or drilling down into specific data points for more detailed insights. This interactivity allows for dynamic exploration of data.
-
Customization: Dashboards can be customized to match an organization's branding and specific requirements. Users can arrange and resize visuals, add text boxes, images, and custom backgrounds, and choose color schemes.
-
Sharing and Collaboration: Dashboards can be published to the Power BI service and shared with colleagues, teams, or stakeholders. Collaborators can view dashboards in web browsers or mobile apps, making it easy to share insights across the organization.
-
Security and Access Control: Power BI offers security features, allowing administrators to control who has access to specific dashboards and data. This ensures that sensitive information is protected.
-
Integration: Dashboards can incorporate data from a wide range of sources, including databases, cloud services, Excel spreadsheets, and more. Power BI offers connectors and integration options to simplify data extraction and transformation.
Power BI dashboards are valuable tools for monitoring business performance, tracking progress toward goals, and providing decision-makers with a clear, visual representation of data. They complement Power BI reports, which offer more detailed analysis, by offering a high-level overview of data in a single, interactive view.
Power BI Dashboard vs Report
When it comes to Power BI's wolrd, we have seen there are a few differences between a report and a dashboard. While both serve as tools for visualizing and analyzing data, they have distinct purposes and characteristics:
-
Power BI Report:
-
A Power BI report is a collection of data visualizations, tables, and charts that are created from one or more datasets.
-
Reports are designed to provide detailed and interactive data analysis. They allow users to drill down into specific data points and explore data in-depth.
-
Reports typically consist of multiple pages or tabs, each containing various visuals that convey different aspects of the data.
-
Users can create, edit, and customize reports to suit their specific analytical needs.
-
Reports are ideal for data analysts and power users who want to perform detailed data analysis and create rich interactive visuals.
-
-
Power BI Dashboard:
-
A Power BI dashboard is a single-page, at-a-glance view of important information and key performance indicators (KPIs).
-
Dashboards are designed to provide a high-level overview of data and are meant to be concise and focused on specific insights.
-
Dashboards often include visuals like tiles, charts, and cards that display summarized data and KPIs in a visually appealing way.
-
Dashboards are not typically used for in-depth data analysis but are intended for quick access to critical information.
-
Users can pin visuals from reports to dashboards to create a consolidated view of key metrics.
-
Dashboards are suitable for business users, managers, and executives who need a quick and easily accessible summary of relevant data.
-
Reports in Power BI are more comprehensive and offer in-depth data analysis capabilities, while dashboards are designed for quick and concise data monitoring, making them suitable for decision-makers who need to track key metrics at a glance. It's common to use both reports and dashboards together to provide a complete data analysis and monitoring solution.
If you're eager to unlock the true power of reporting, be sure to explore our e-book featuring the 15 most impressive Power BI dashboards of 2023!