This article explores the differences between a dashboard and a balanced scorecard and discusses BSC strategy. and discusses the strategy behind the BSC.
Dashboards have become an essential tool for the smooth running of companies and most organisations already use them on a daily basis. However, there is still some confusion about what a balanced scorecard is and how it differs from a dashboard.

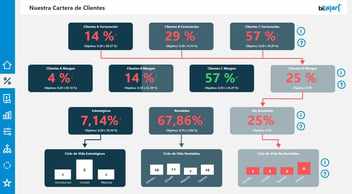
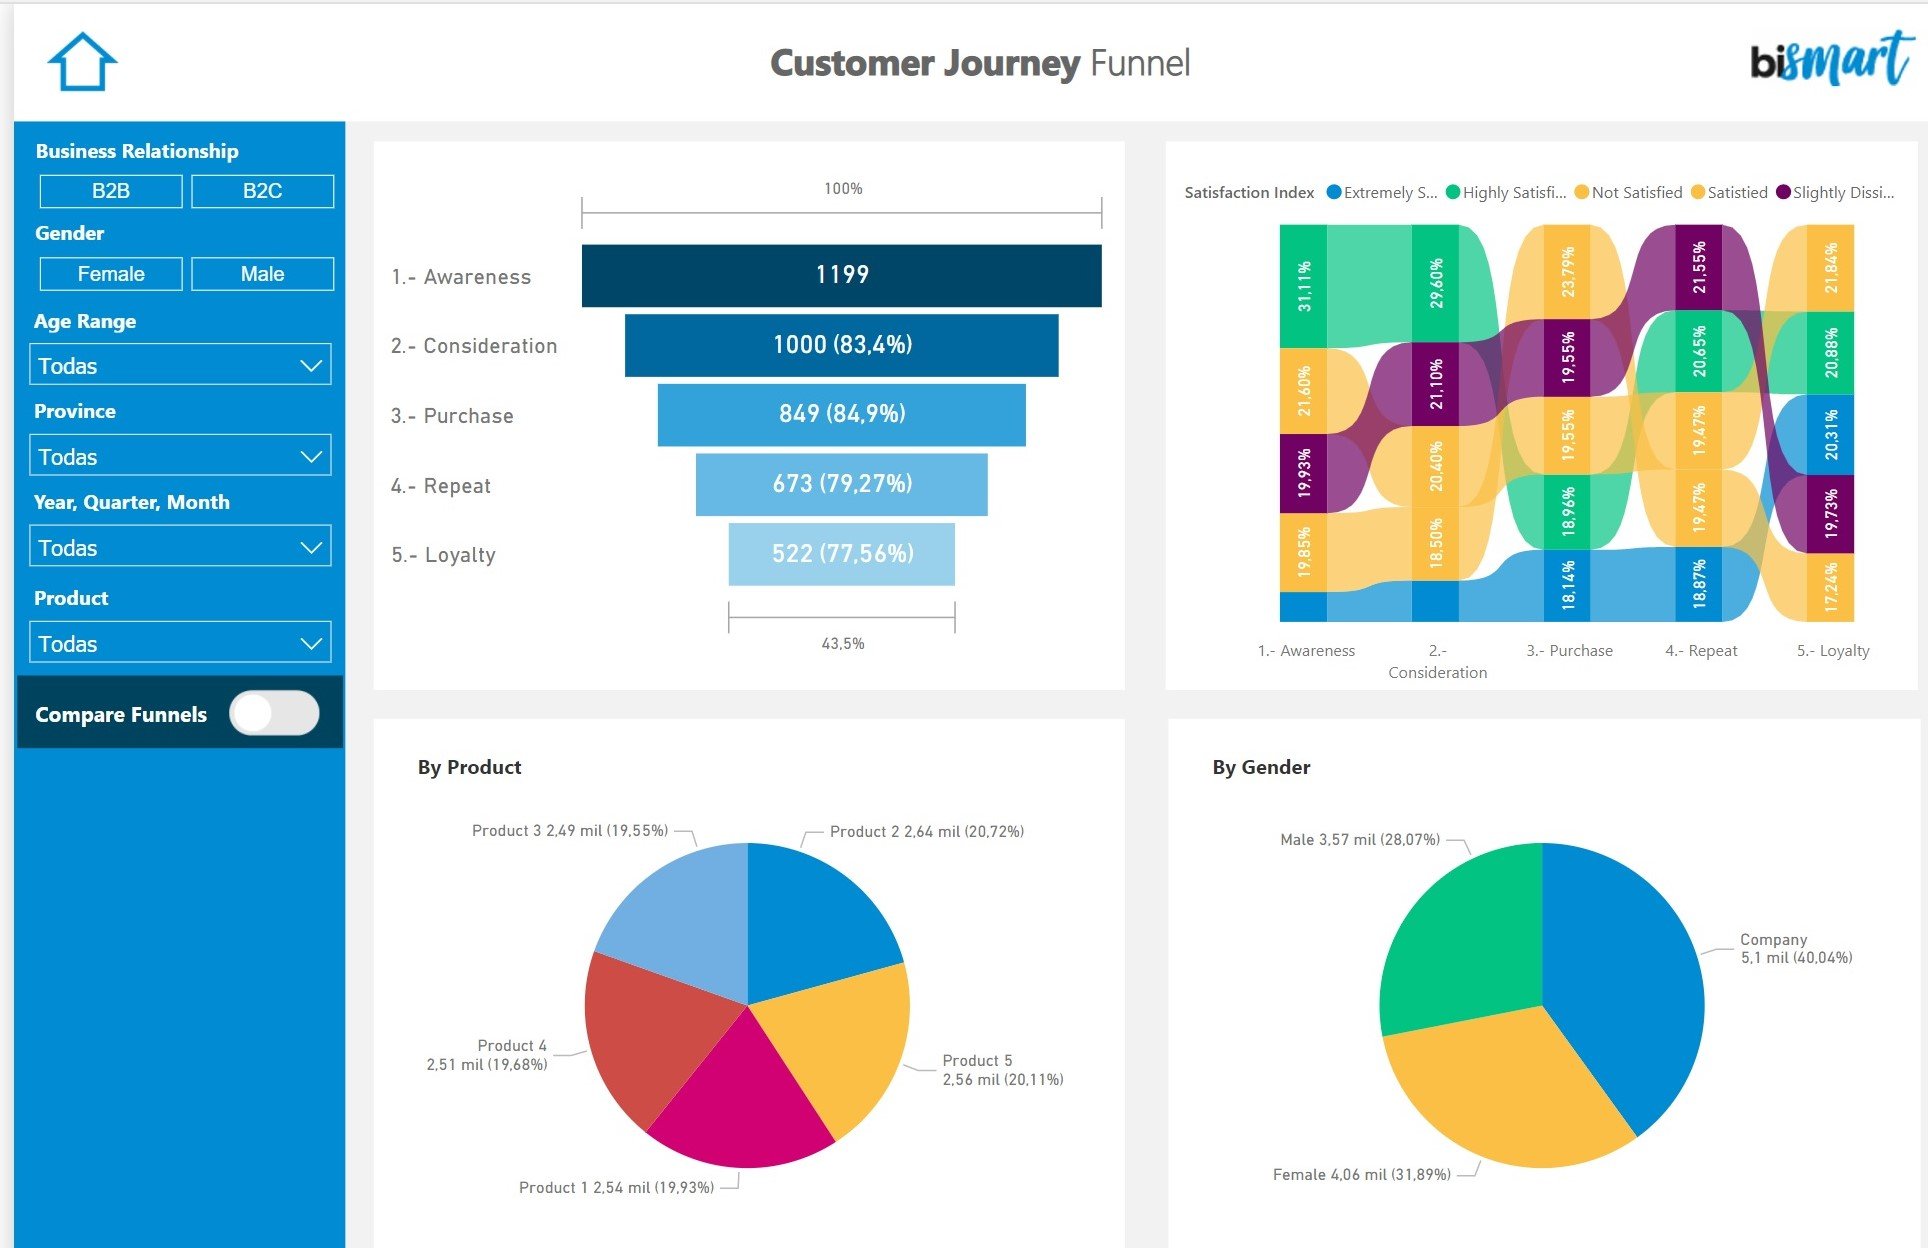
Screenshot of Bismart's Customer Journey Dashboard.
Nowadays, companies and organisations require dashboards to keep track of multiple aspects of their business activity. As we explained in the article '12 Tips You Can't Ignore When Creating a Dashboard', dashboards are used to visually and graphically represent information. Moreover, data visualisation contributes to the democratisation of information and assists managers in the decision-making process based on data (data-driven decisions).
A dashboard can be used to represent any type of information or data set, but for its optimal performance the data must have been previously verified, consolidated and analysed and the dashboard must be consistent with the business logic.
One of the most common areas of use for dashboards is the evaluation and monitoring of the business activity. That is, companies use dashboards to graphically represent metrics related to their activity and track their performance over time.
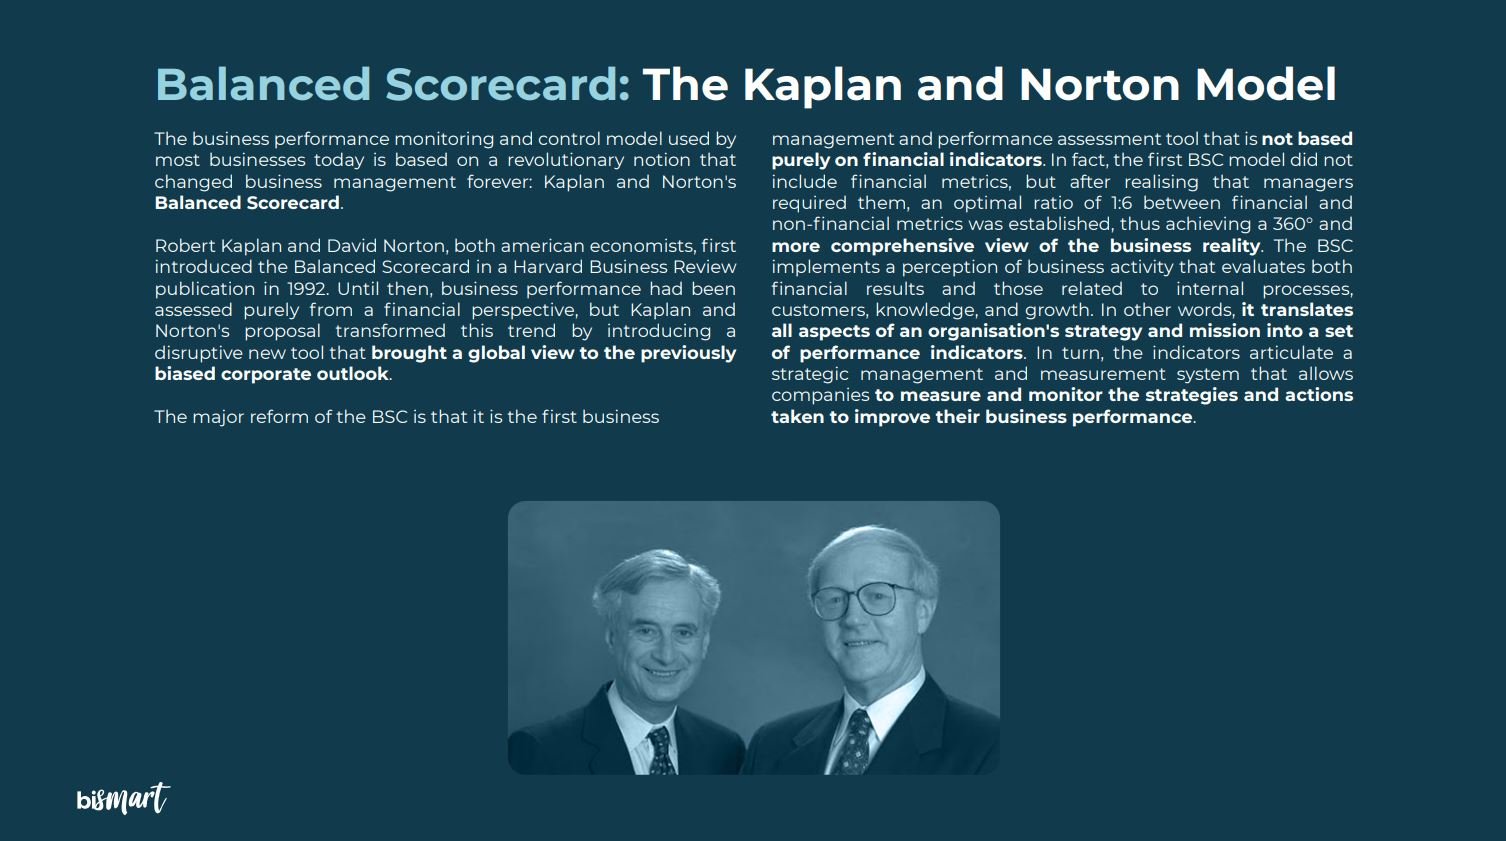
The way of understanding and assessing business performance changed completely in the mid-1990s when Kaplan and Norton introduced the 'Balanced Scorecard (BSC)'. The Balanced Scorecard changed the perspective of analysing business performance, introducing a 360-degree view of the previously biased corporate view that only paid attention to financial metrics.
Thus, today most companies monitor their performance through Kaplan and Norton's approach as they analyse multiple aspects of their activity. However, there is still some confusion about what a BSC is and, even more so, what it should be like and why any dashboard is not a balanced scorecard.
Our business intelligence experts have created the 'Guide to Evaluate Your Company's Performance and Strategic Plan' , in which you will find the essential knowledge to measure your company's strategic plan and action plan. It also includes the basics of the Balanced Scorecard (BSC), Key Performance Indicators (KPIs), setting strategic objectives, developing action plans and performance indicators.
What is a Balanced Scorecard?
The Balanced Scorecard (BSC) is a tool used to represent and evaluate the overall business activity. It translates all the aspects that make up an organisation's strategy and mission into a set of performance indicators. In turn, the indicators articulate a strategic management and measurement system that allows companies to calibrate and track the strategies and actions established to improve business performance.
A Balanced Scorecard is not just any dashboard. The BSC should include all the aspects related to a company's strategic and action plan which, in the scorecard, are represented by performance indicators and KPIs. Thus, according to the balanced scorecard perspective, all performance indicators should be related to a business objective which, in turn, will be part of the corporation's strategic and action plan.
The balanced scorecard, therefore, integrates all the aspects that make up the business strategy and is used to assess and evaluate the evolution of the business performance, the result of the strategies and actions carried out and, in short, to gauge how a business is progressing towards the fulfilment of its objectives.
For more information on how to create a BSC, what performance indicators and KPIs should be like and how to calculate them, you can download our 'Guide to Evaluate Your Company's Performance and Strategic Plan'.
What is a Key Performance Indicator (KPI)?
A Key Performance Indicator (KPI) is a metric used to measure the performance and progress of a specific aspect of a company's business activity. Unlike a dashboard, which focuses on analyzing a specific area or project, KPIs are aligned with the overall strategic and action plan of the organization. They provide a clear and measurable way to track the achievement of business objectives. KPIs should be directly related to a specific business objective and should be consistent with the overall strategic plan. By monitoring and evaluating KPIs, companies can assess their progress and make data-driven decisions to improve their performance. Understanding the importance of KPIs is essential for optimizing business performance monitoring and evaluation. To learn more about creating effective KPIs and evaluating your company's performance, you can download our comprehensive guide.
What is a dashboard?
A dashboard is a tool that visually represents a set of metrics related to some aspect of business activity.
Dashboards are used by organisations to monitor and analyse certain aspects of their activity, although they do not provide an overall view of a company's strategic and action plan.
In contrast to the BSC, a dashboard is used to analyse a specific activity area. For example, the performance of a department, the success of a specific campaign or project, etc. In this sense, the indicators of a dashboard are focused on the analysis of specific processes and operations, not on the evolution and progress of the company's strategic plan.
Besides the Balanced Scorecard, there are other types of dashboards:
What are the differences between a balanced scorecard and a dashboard?
As we have already seen, a dashboard and a balanced scorecard serve different functions. The balanced scorecard is an articulated system that helps organisations optimise their business performance and make the decisions that will shape their strategic and action plans. It is therefore crucial that companies understand the strategic approach of the BSC and that they implement the tool in accordance both with the foundations of the BSC and their own business logic.
In addition to different uses and approaches, the design and contents of a dashboard and a BSC also differ.
The balanced scorecard visually represents the business objectives, KPIs and performance indicators and provides a complete map of the organisation's strategic plan, through which the action plan is defined. It should also help senior managers to communicate the corporate strategy.
A dashboard, on the other hand, visually represents indicators related to a specific area of the business activity and is used to track the specific objectives of the project or initiative in question.
In terms of design and content, a Balanced Scorecard should include:
- A strategic map that reflects all the business objectives set by the organisation and their subsequent transformation into performance indicators and KPIs.
- A matrix including all strategic objectives, KPIs and performance indicators.
- Colours, alerts and other evaluation features that visually symbolise whether performance and achievement of business objectives is within the company's acceptable parameters and how the business is evolving.
The design and content of a dashboard, meanwhile, is highly variable and will depend on what we want to analyse. However, most dashboards usually include charts, tables and other visuals that represent the operational objectives and short- to medium-term performance indicators.
In short, we could say that a dashboard shows us what we are doing, whereas a balanced scorecard informs us of whether we are doing well or not.
Are you interested in improving your business performance monitoring and evaluation model? Do you want to optimise your dashboards and define your KPIs better?
In this webinar we explain the key concepts of a dashboard, talk about the difference between data and performance indicators and explain how to make your dashboards more useful and productive.
Before we go...
If you want more information on how to create a balanced scorecard, what performance indicators and KPIs should look like and how to calculate them, you can download our 'Guide to assessing business performance and a company's action plan'.