We explain what an operational dashboard is, what it is for and how you can create one following 5 simple steps. Don't miss it!
The mission of a dashboard is to solve specific business needs and to support the decision-making process. For this to happen, it is essential that a dashboard responds to defined business objectives and is designed with the target audience in mind. We explain what an operational scorecard is and how to design it to do the job.
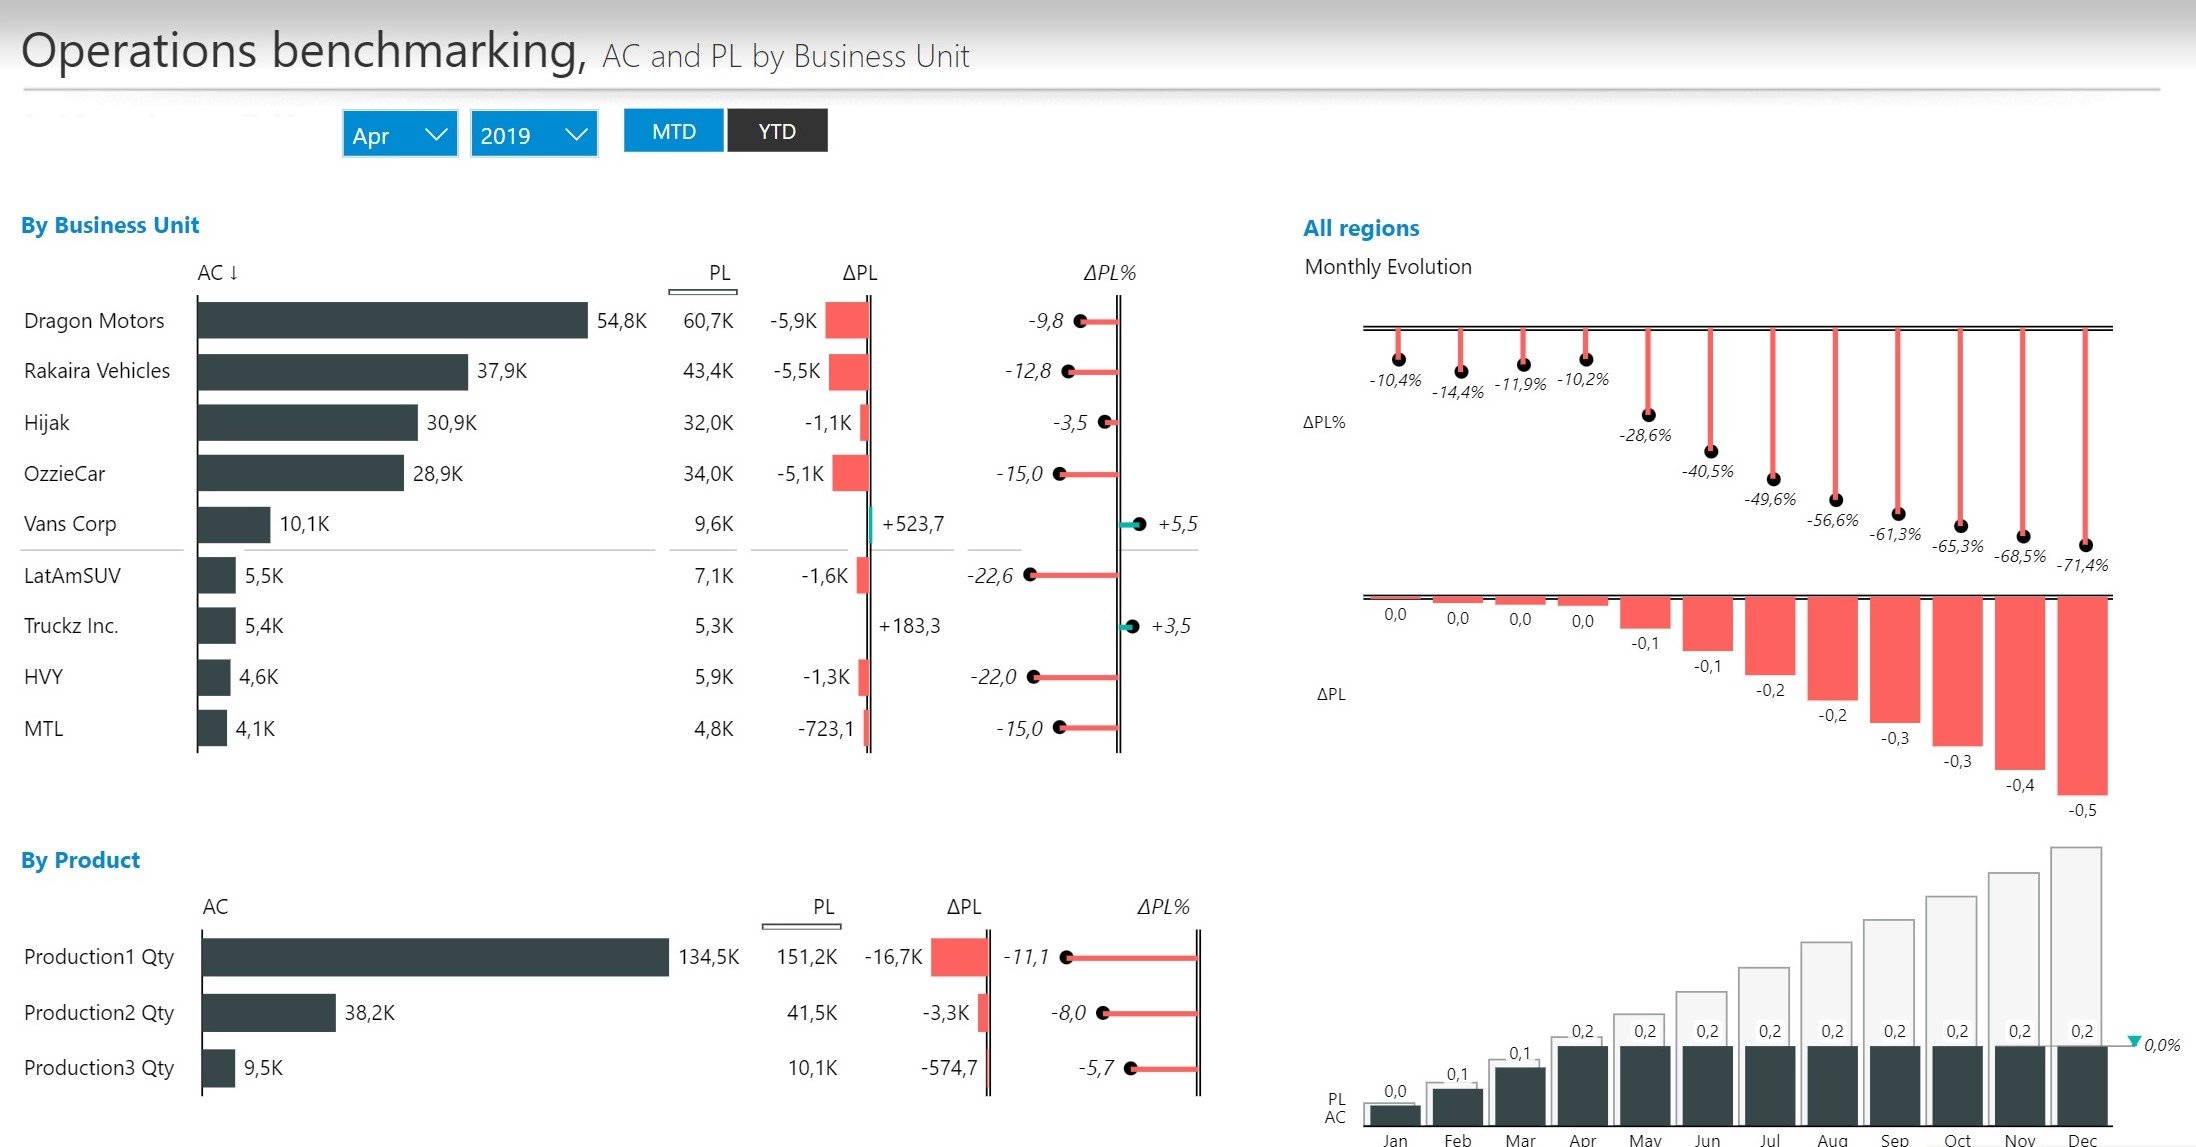
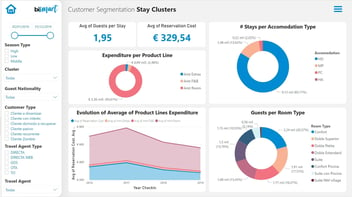
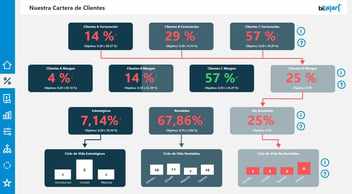
Captura de un cuadro de mando diseñado por Bismart
Dashboards are one of the essential operational tools of organisations. Their purpose is to meet the information needs of companies by transforming data into easy-to-interpret information that leads to conclusions and data-driven decisions.
As we have explained previously in this blog, there are many types of dashboards. For a dashboard to be useful and respond to the specific business needs of a company, it is crucial that its design is adapted to the business objectives it aims to solve, its target audience and its purpose.
In this sense, before creating a dashboard, it is essential to know the different types of dashboards that exist:
- Executive dashboard
- Analytical dashboard
- Operational dashboard
- Educational dashboard
In previous posts we have explained what executive dashboards and analytical dashboards are and how to design them. This time we focus on an operational dashboard: what is it, what is it for, and how should we design it?
What Is an Operational Dashboard?
An operational dashboard is a business dashboard whose function is to monitor the performance of different business operations related to a specfici business area. It is primarily used to monitor and evaluate the performance and execution of ongoing processes and operations.
Therefore, the data included in an operational dashboard is mainly operational data. In other words, this type of dashboard includes operational performance indicators and KPIs related to the performance of the processes and activities of one of the business areas of a corporation. Thus, it fulfils a vital function for any organisation: to keep track of a specific functional area of the organisation, as well as the different ongoing operations related to that area.
Unlike other types of dashboards the operational scorecard has a medium/short-term vision of reality, as it serves as a support tool for urgent decision-making. However, like the vast majority of dashboards, historical data plays an important role in this type of scorecard insofar as the comparison between time periods is significant for making any type of decision. In the case of operational dashboards comparisons are usually monthly, quarterly or four-monthly and do not usually lead to long-term comparisons.
In addition to being the main tool for reviewing the course and functioning of all the business areas, the operational dashboard is crucial for identifying errors or areas for improvement and being able to anticipate any problems related to ongoing operations and processes.
To design a good operational dashboard, however, we must be aware of its limits and respect them. Although this kind of dashboard explores the different business operations, it offers a limited view of the business activity and should not be confused with a balanced scorecard, as it is not a global strategic management tool, but is limited to specific business areas and to a narrower time period than a BSC.
How to Create an Operational Dashboard in 5 Steps?
The first step to design an operational dashboard is the same as for designing any dashboard: defining the purpose of the scorecard, identifying the business objectives we want to represent and transforming them into performance indicators.
The creation of a dashboard, far from being an independent task, is closely linked to the overall strategic plan of an organisation. Thus, the definition of business objectives and their subsequent conversion into performance indicators and KPIs is much more important than technical aspects when developing a dashboard.
- Find out how to carry out a complete business strategic plan with our "Guide to Evaluate Your Company's Performance and Strategic Plan".
On the other hand, a dashboard simply transforms data into intelligible and digestible information. Therefore, proper monitoring of business operations also depends on other data management processes such as data analytics, data governance or data quality.
1. Establish your business objectives. The first step in creating an operational dashboard is to establish the business objectives related to the operations and processes of a specific business area. It is essential to spend time on this stage of dashboard creation, as all other stages will depend on it.
2. Define KPIs and performance indicators. Once we are clear about the objectives we want to measure, we must transform them into performance indicators that will help us to evaluate the course of the achievement of these objectives over time.
3. Identify and integrate your data. Obviously, data is the basis of any scorecard. So, once we know what we want to measure, we need to find out if we have the data we need and, if not, collect it. If we already have all the data sets we want to capture on the dashboard, we need to make sure that they are in a compatible format so that they can be compared. If our data are in different sources and contain disparate formats, we will need to perform a data integration process.
4. Choose a BI tool. To create a dashboard we need a business intelligence tool that allows us to convert data into information and information into knowledge. At Bismart, as a preferred Microsoft Power BI partner, we develop our dashboards and reports with Power BI.
5. Data visualization. Once our data has been integrated into the dashboard we can start working on the structure and design of the dashboard. Data visualisation is one of the most important tasks in creating a dashboard. Therefore, if we work with Power BI, for example, choosing the right Power BI visuals can be decisive in determining the success or failure of our dashboard.
Conclusion
In this part of our series on types of dashboards we have seen what an operational dashboard is, what it is for and how to design one. Taking into account the business objectives we want to solve and the target audience is essential for our scorecard to meet the information needs for which it has been designed.
Each type of dashboard responds to concrete needs and is used by a specific figure within an organisation.
So far we have explored executive dashboards, analytical dashboards and the operational dashboards. In the next and final article of this series we will look at what an educational scorecard is and what it is for. Don't miss it!
Finally...
Do you want to create optimal dashboards in Power BI? Check the 10 best Power BI dashboards of 2021!