We are becoming used to understanding from image, so visualization has also become the platform on which to decide better.
At the end of 2017 I had the chance to attend a Katy Perry concert from her fourth world tour, Witness. In that concert she interpreted her most famous hits as well as new songs, while an exercise of impressive production unfolded in which dozens of dancers dressed in a thousand different ways, rivers of colors, starry skies presided over by a giant mouth, androids with screen heads, basketball courts, roller coasters, tigers and goddesses riding them. All this happened at a very high speed and without any solution of continuity in a great party of unappealable visual impacts where there was not a second of space to blink. Half an hour after the concert ended, I was still assimilating that exercise of contents that, I thought, was trying to tell me a story not only through lyrics and melodies, but also through an image that recreated universes, ways of thinking, opinions and, as a result, decisions.

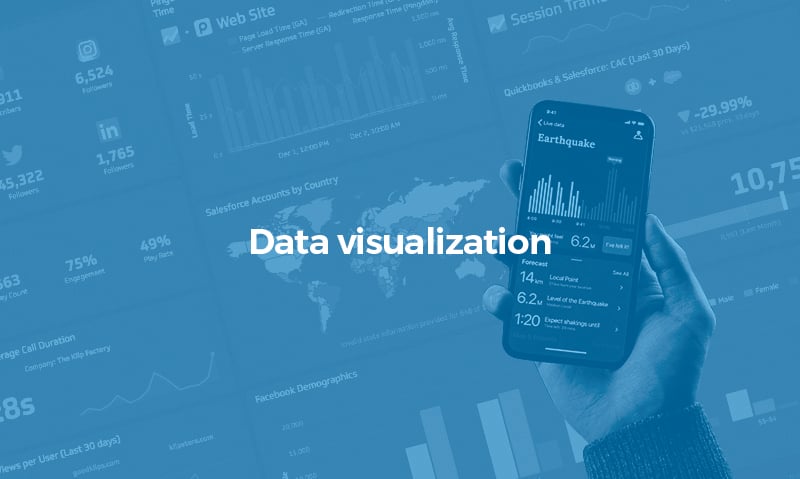
How many times have we heard that "seeing is believing"? Or that "a picture is worth a thousand words"? Sentences typical of our collective imaginary that take over our way of thinking and, finally, of being. Well, beyond being a common saying in our culture, visualization is at the center of the inertias that shape us and among which we find ourselves and in many ways. Not only when it comes to wanting to see what we buy and being able to look at it in a thousand ways on the screen of our mobile devices, but also when it comes to content consumption, entertainment or learning. We are becoming used to understanding from image and, through it, to substantiating what is key and essential for having fun, acquiring knowledge or feeling. Image as a stimulus has always been relevant in these areas, but was it as relevant before as it is now?
In that same order of things, visualization has also become the platform on which to decide better. The visualization of an abstract thought by means of a graphic representation of it or to have an ordered scheme of the pieces that compose it and the importance of each one, helps us to understand it better, to take sides, to position ourselves, to give our opinion. We see it in the visualizations that are presented in the newspapers during the electoral period, in the graphs that explain the performance of the tennis players in the final of Roland Garros and lead us to see who is playing better aside of what we think, or in the graphs on the evolution of our physical activity that appear in our mobile or intelligent watch. From there to decision making there is a very small gap.
These examples that appeal to any everyday area of our lives, project them to the business world, where decisions are continuous and essential. Add to this the fact that the context surrounding many of today's decision-making businesses is volatile, uncertain, complex and ambiguous (VUCA), and this means that professionals and organizations need to develop their capacities to make better decisions. And that makes focus on the data, its analysis and of course the possibility of visualizing them in an easy and strategic way.
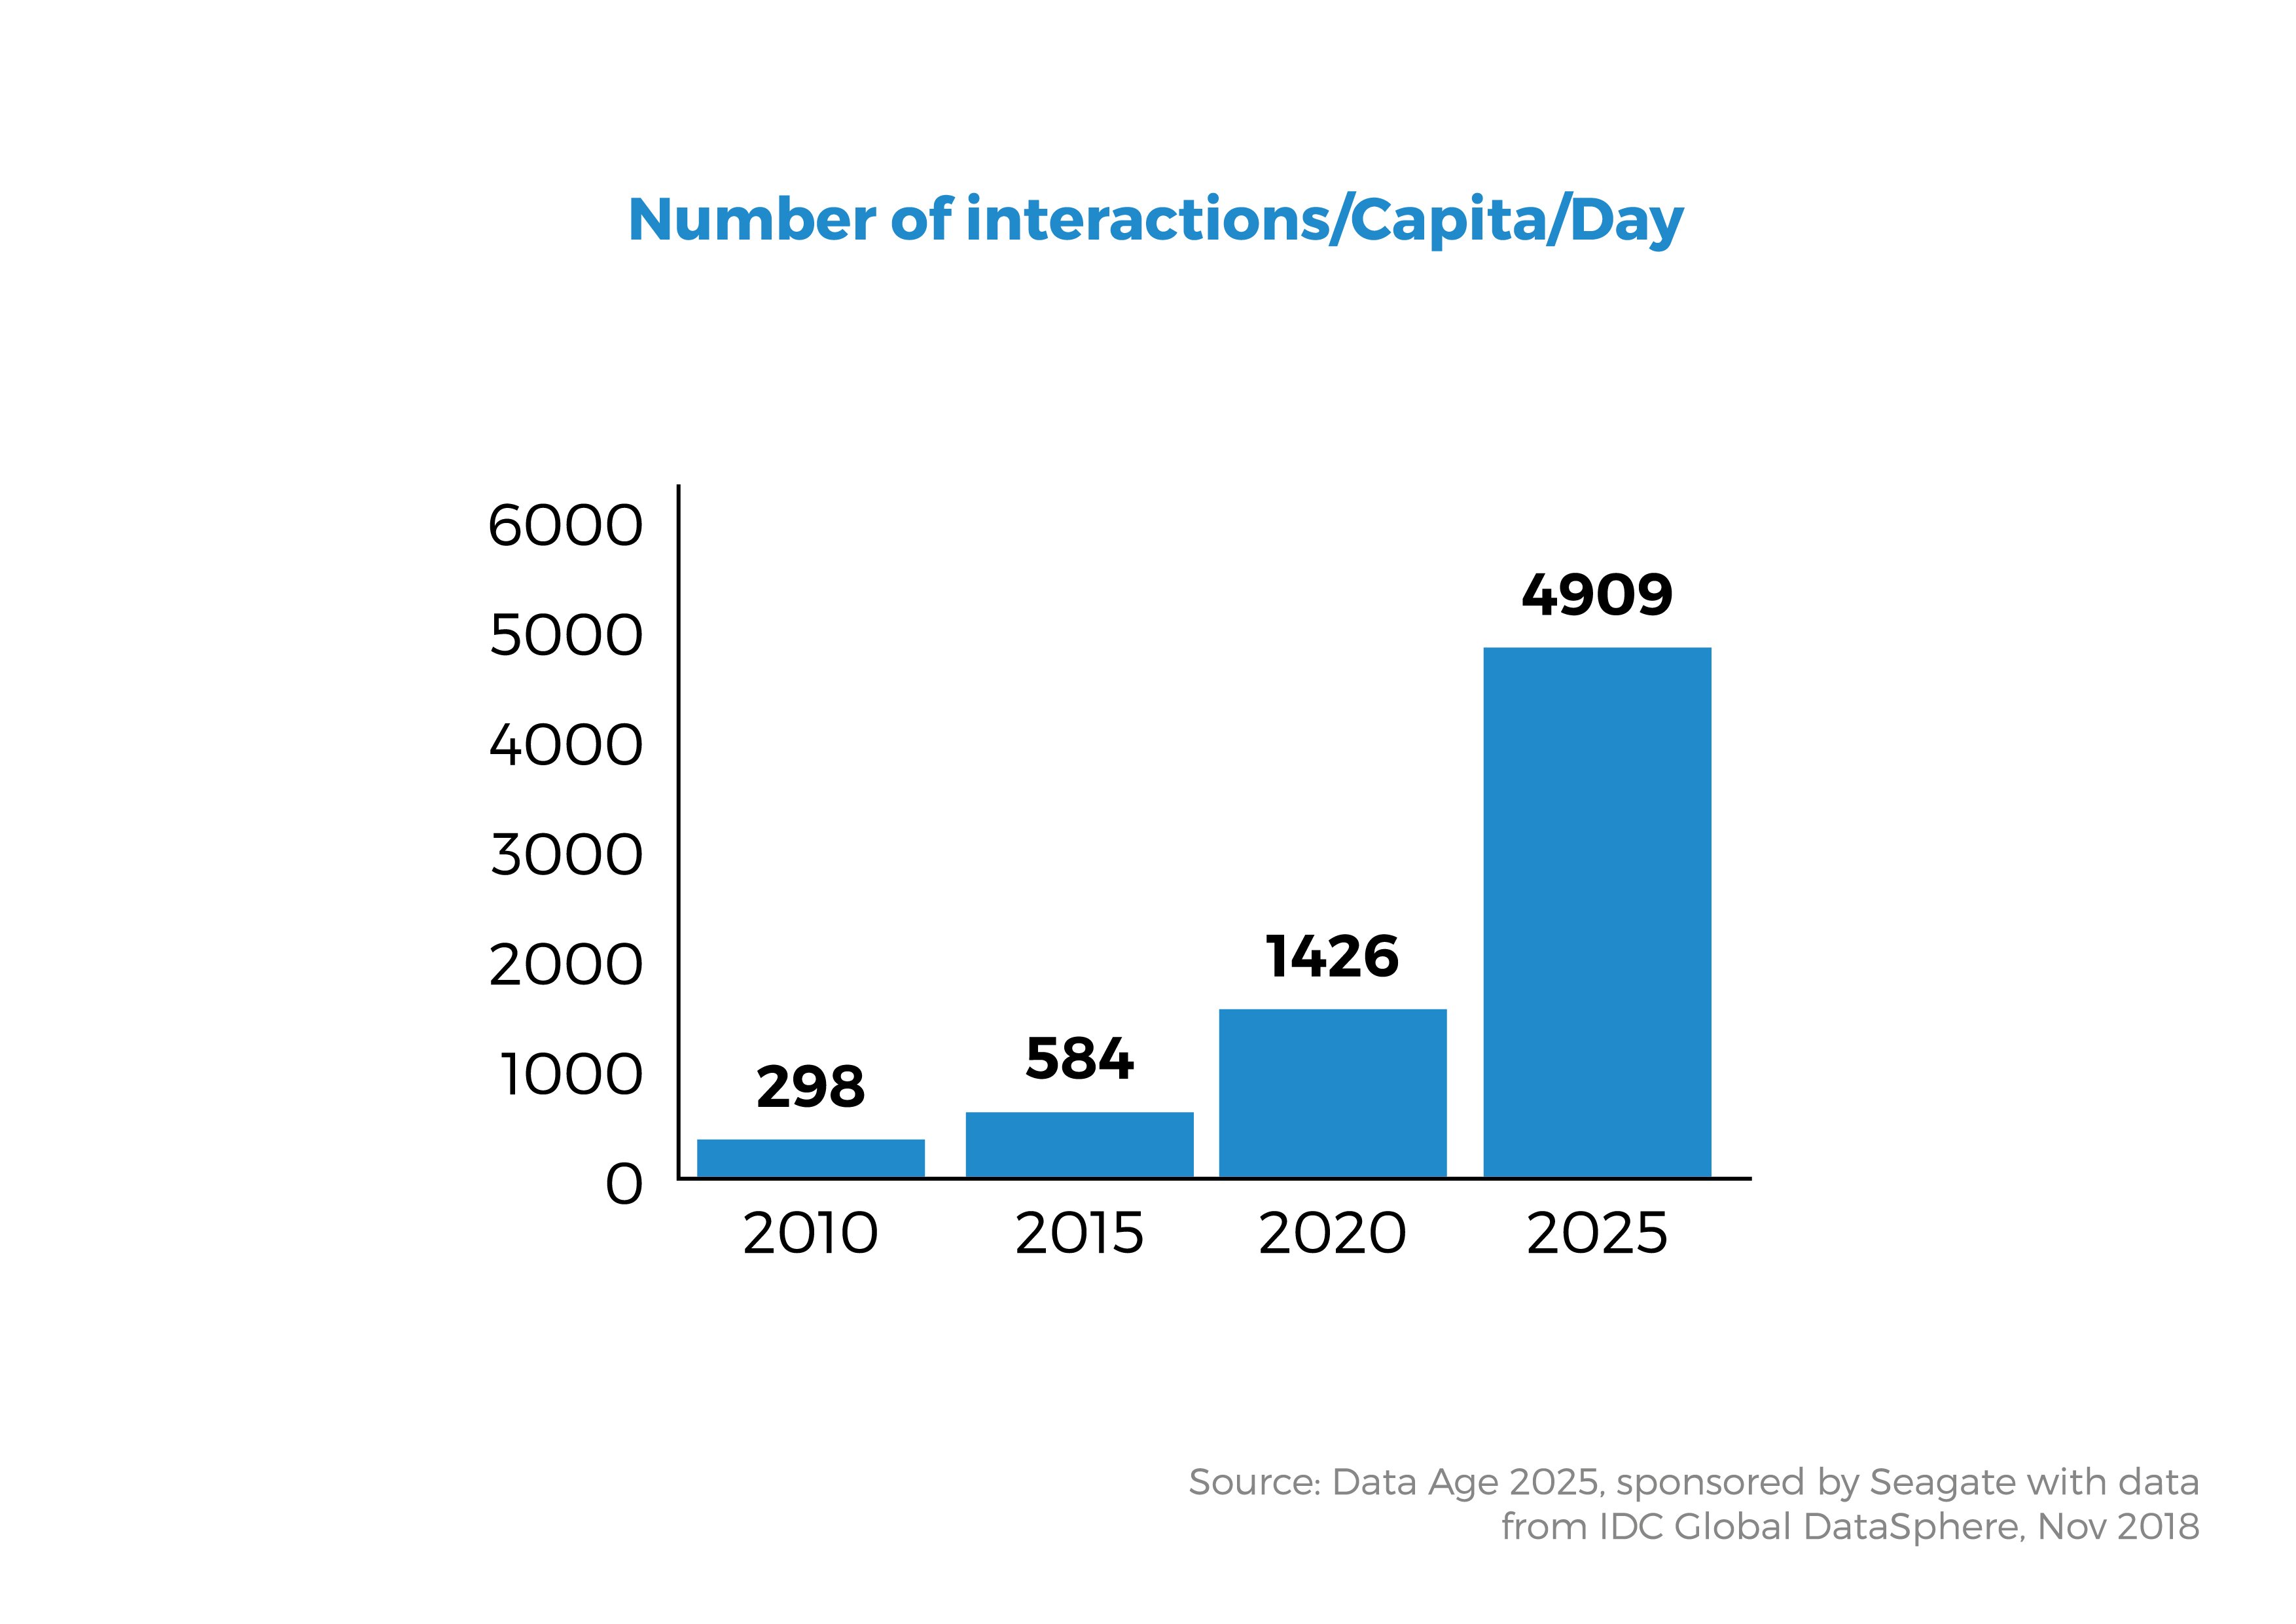
In the era of 5G, and in full development of the internet of things, each step we take will generate information that can be used, once captured, ordered and enriched, to make a decision. To give an order of magnitude to this statement we can say that the projections to 2025 of the Data Age report indicate that the volume of annual data in the datasphere will be 175 Zettabytes and the number of interactions per person capable of generating data will be more than 4,900 a day.
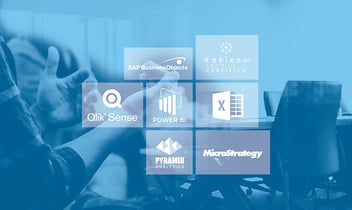
Companies are going to have an increasingly valuable raw asset to which they can apply a polishing solution. That solution is analytics and intelligent visualization of information. In fact, you only have to look at what is happening in the market for acquisitions by the big technology players to have a clear look at where the next few times are headed. Google buys Looker, a firm specialized in data analysis, for 2,600 million dollars; days later Salesforce buys Tableau, one of the referent platforms in the same field for 15,700 million dollars, and Microsoft and Oracle sign an agreement to connect their clouds (in addition to Microsoft's declared bet for its Power BI solution, considered by Gartner as the leading platform in the market in analytics and visualization for Business Intelligence).
It seems that these large companies envision that the power to manage large amounts of data, analyze it, and deliver a visualization that helps decide is going to be essential to business leadership. From there we can reflect on what makes these functions so essential in the current context. Well, if the decisions that are being made today from any area of business should be:
- In real time
- Efficient
- Integrated with the different areas / channels of the company
- Action-oriented
Having the ability to analyze information in real time, identify which variables most influence sales, efficiency, quality, satisfaction, happiness, value for our customers and employees from a simple, pleasant and manageable dashboard increases the capabilities of any professional, department or company. In short, visualization helps to:
- Place the customer at the center of the company's decisions and become consumer-centric.
- Better understand what's going on in the organization.
- Allows to measure and analyze impacts.
- Allows to identify problems with agility.
- Identify insights and business opportunities.
- Allows you to create stories.
- Foster Lean environments.
- Scalability.
- To have more connected organizations that escape from the silos.
- Activate transparency in the organization and the consolidation of "truths" against hypotheses or inertias.
- Feeding an agile leadership model.
In the era of data where everything is measurable, the visualization of data is the best vehicle to be able to have more capable organizations, that transfer their ideas better, are more fair, flee from false beliefs, dialogue with their customers and collaborate more easily challenging the rules of our increasingly volatile and unpredictable markets.
Borja Martín | Head of Data Strategy & Insights