We discuss the differences between a dashboard and a corporate report. Which one should you use?
To meet their business intelligence needs, companies work with dashboards and reports to analyse and visualise their data. However, a dashboard is not the same as a report and organisations use both platforms for different functions. We discuss the difference between a dashboard and a report and explain which one to use in each case.

Dashboards and reports have become essential tools for any company. In the age of data, businesses require environments where they can analyse and visualise their data to make it understandable, transform it into information and be able to make data-driven decisions.
Both dashboards and reports act as platforms for the democratisation of data, as they illustrate and present data in an understandable way so that any user can draw conclusions, inspect business activity in depth and make informed decisions. However, a dashboard is not the same as a report, and they certainly do not fulfil the same function.
In a previous blog post we explored in depth what a balanced scorecard is and what it is used for. We have also previously explained the differences between a balanced scorecard and an ordinary dashboard. However, understanding the differences and particularities of corporate dashboards and reports is essential to create them effectively.
Main differences between a dashboard and a report
Not only do reports and dashboards have a slightly different format, but they are also used to represent different topics.
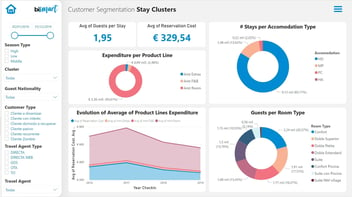
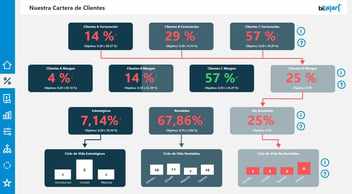
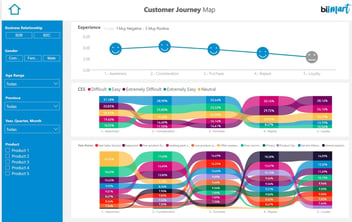
A dashboard is a visualisation tool that contains the most important information on a topic, usually information related to the performance of the business, a business area or a particular department. A dashboard is used as a tool to monitor the performance of an area of the company.
In this sense, dashboards always contain metrics, performance indicators and KPIs, as well as represent data in a concise and clear way, as they are intended to guide business decision making.
In a dashboard, the big picture is more important than the detail. Thus, the information is usually distributed on a single screen that graphically explores the achievement of business objectives related to some area.
Reports, on the other hand, can cover issues of any scope and can be used for data that does not necessarily have to be related to business performance —although it can be—. For example, we can create a report to quantify and track the progress of a particular project that, once the project is completed, we no longer need.
Corporate reports usually have several screens or pages with graphs and tables to represent the information and although they are more detail-oriented and accurate than dashboards, they aim to provide an overview of the reality being explored through detailed and well-arranged information.
Thus, dashboards comprise charts, graphs and visuals that can explore different topics —providing a 360° view of reality— whereas reports are usually focused on a single topic.
We could say, then, that dashboards can be built from the visuals, graphs or tables of various reports.
In addition, it is common for a dashboard to raise more questions aimed at optimising some aspect of the business than reports.
One of the main differences between dashboards and reports is that dashboards do not usually have an expiry date, whereas reports do. In other words, dashboards are dynamic and perennial in nature, whereas reports are static in nature.
A dashboard usually focuses on a theme to be explored over time, represented by indicators that are updated in real time and visualisations that show the evolution of the data over time. Reports, on the other hand, are used to monitor projects or themes of a specific duration. In this sense, they are usually produced periodically and the data need not necessarily be updated in real time.
In short:
When to use a dashboard?
As we have already specified, most companies use both formats to represent and analyse their data. Both dashboards and reports must be aligned with the business logic and, therefore, the choice of one or the other will ultimately depend on the particularities and needs of each organisation, with the business logic dictating the use of the tools.
Generally speaking, however, we will use a dashboard to graphically represent an aspect of the overall business activity that needs to be explored over time. Dashboards are diagnostically oriented and are ideal for quantifying the achievement of business objectives and visually representing the evolution of business performance. Thus, a dashboard is the ideal tool to support executives and managers in making important decisions.
When to use a report?
A report is used when we need to perform an in-depth analysis of a specific aspect over a specific period of time. Thus, a report is the ideal tool to monitor and study a thematic area in an exhaustive and detailed way over a finite period of time.
At Bismart, as a Microsoft Power BI partner, we develop our reports and dashboards with this tool. Our team of Power BI experts has developed an e-book with what, according to their experience, are the 21 best practices for creating reports in Power BI.
Do you want to optimise your reports?