Take a look at the top 10 Power BI dashboards for 2021. Find out what metrics they include by downloading our e-book for CEOs.
One of the most useful Power BI possibilites is the creation of corporate dashboards that companies use to monitor the performance of one or several business areas. As it happens with all technologies, dashboards and their creation settings are constantly evolving. We present the best corporate Power BI dashboards!

In this blog we have talked about Power BI and its creation possibilities on numerous occasions. As a preferred Microsoft Power BI partner, we have a team of experts specialised in Power BI and we use it to develop our solutions.
Our team of experts has prepared an e-book for CEOs in which they list the 15 must-have business dashboards. Don't miss it!
Among other things, organisations use Power BI to create dashboards; the main environment used for monitoring and analysing business performance. Dashboards are intended to guide managers so that they can make data-driven decisions rather than rely on their instinct, and to present the results of data analytics work in a way that is visually appealing and promotes the understanding of performance indicators and KPIs. Without reliable, quality information that is easy to understand, making efficient decisions is nearly impossible.
Power BI provides a wealth of dashboard creation and design options, offering a service that allows companies to customise dashboards to meet their business needs.
Companies often require multiple dashboards to study and track their different business areas, departments, projects or campaigns. Also, over time, some dashboards become outdated and are replaced by others that are more aligned with the demands of an increasingly digital, multidimensional and technological market.
For all these reasons, our team of business intelligence experts has selected the 10 best Power BI dashboards for 2021, which we list below.
In addition, we have created an e-book for CEOs in which you will find the 15 must-have dashboards for 2021, with examples and an explanation of the metrics that each dashboard should include. The guide also includes 5 other specific dashboards for healthcare, utilities, the public sector and retail companies. Don't miss them!
Top 10 Power BI dashboards
1. Finance Dashboard
Finance dashboards continue to be an essential staple for any company. Financial dashboards include a company's most important financial indicators and serve an essential function within the company: to ensure that the business economics are on track.
The metrics or performance indicators of a financial dashboard may vary depending on the nature and business logic of each organisation. However, any financial dashboard will include basic metrics such as forecasted and actual revenues, net income, forecasted and actual costs, inventories, etc.
2. Sales Dashboard
Sales dashboards are another essential for any organisation. These dashboards are used to track sales against previous periods and help managers to analyse the productivity of the sales team.
Sales dashboards also include information on the performance of different product groups as well as different sales channels. Some include more in-depth information on the revenue generated by different customer segments, the units sold in each of the active regions, the profitability of sales in each geographic area, or the return on investment of sales campaigns or promotions and offers generated that year.
Obviously, this type of dashboard includes the KPIs that express the achievement of the company's most important sales goals.
3. Indicators & Dimensions Definition Dashboard
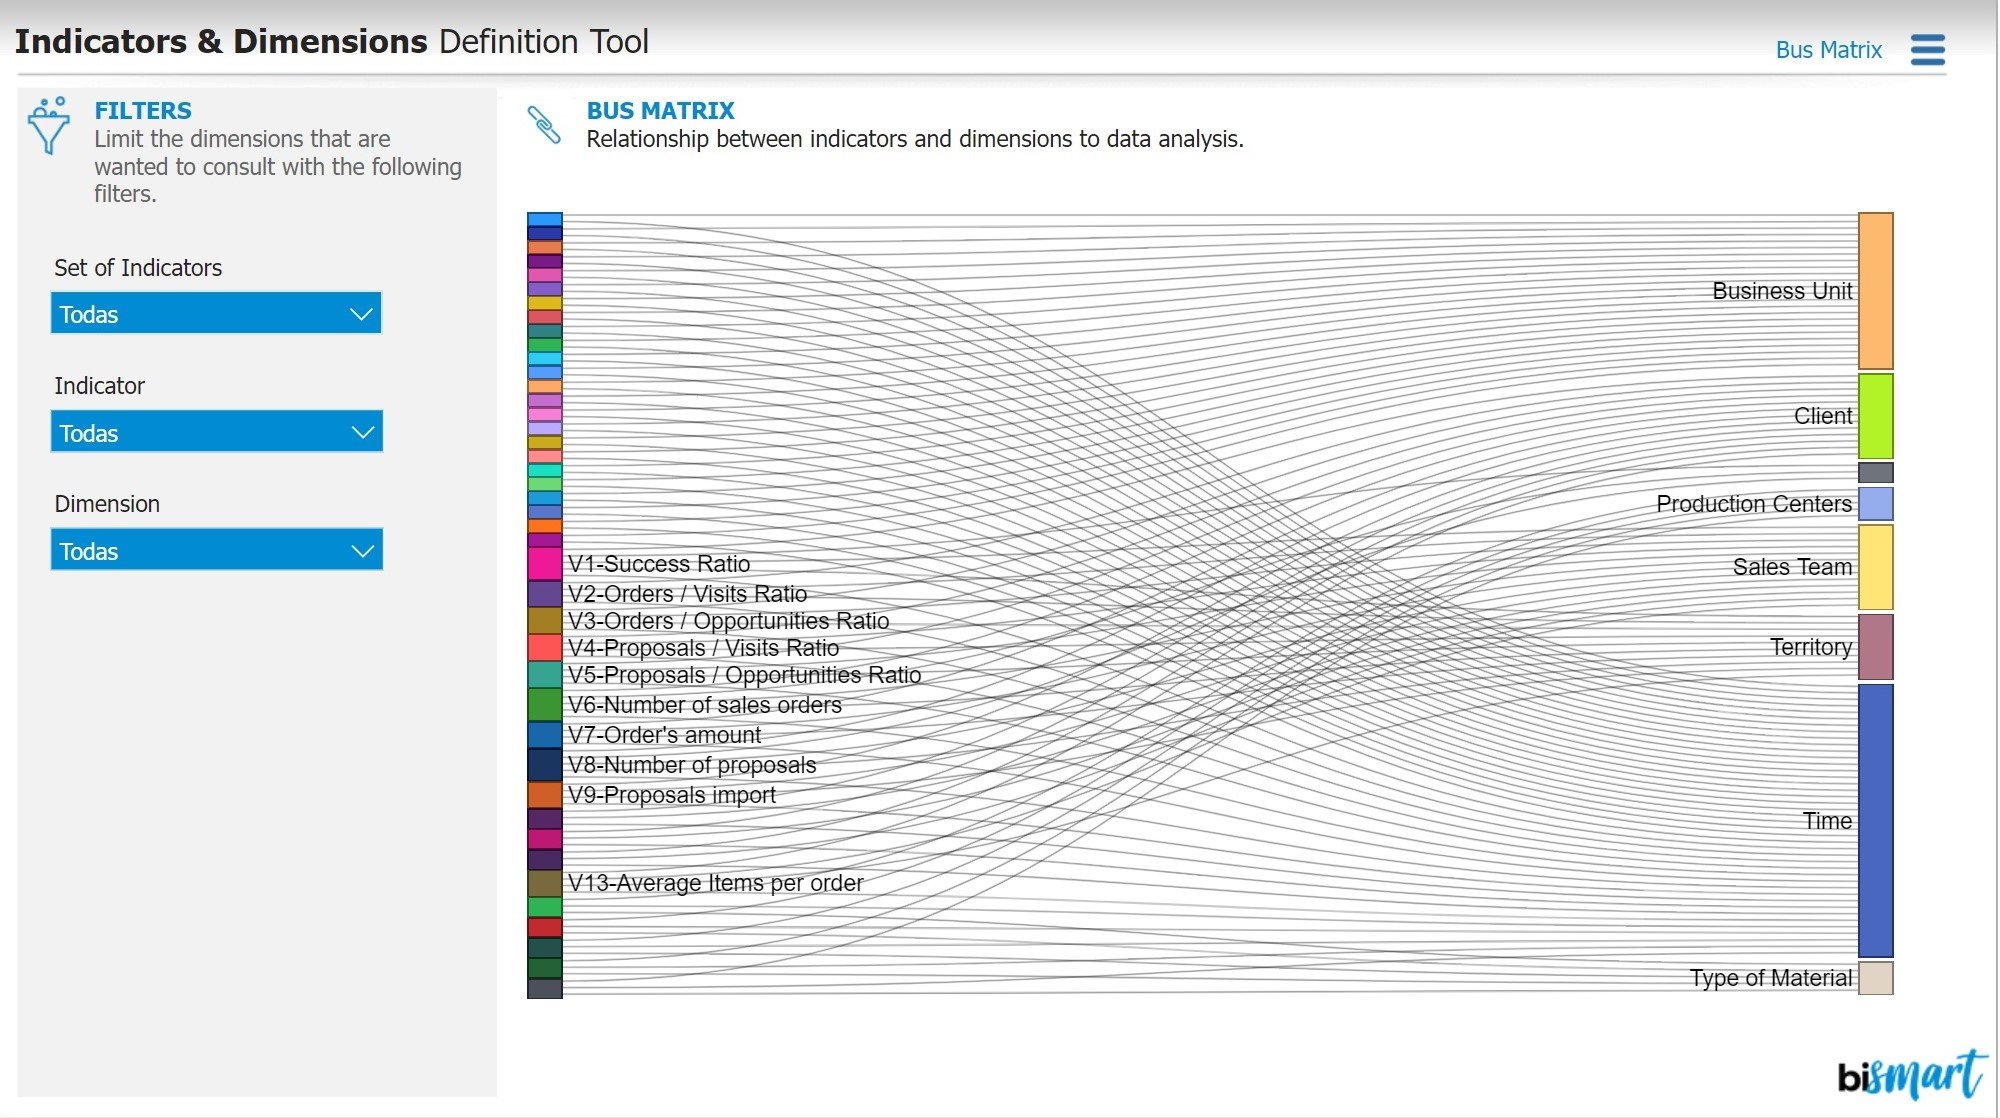
Performance indicators are the basis for monitoring business activity. If performance indicators are not well defined and do not point to the right data, business strategies are likely to suffer. If we do not work with the right information and do not measure results properly, we will never make progress.
In this sense, dashboards dedicated to the management and publication of data defining indicators, dimensions and the relationships between them are highly relevant.
A dashboard of indicators and dimensions is an analytical environment, both at a functional and technical level, that promotes correct communication between the IT department and the rest of the functional areas of a company.
Thus, this dashboard translates into greater autonomy for all members of an organisation by providing them with an environment where they can consult key information to monitor business activity.
On the other hand, this type of dashboards minimise errors caused by the wong use of indicators, optimise the results of monitoring meetings and reduce the amount of time spent on reporting.
4. Cost Optimization Dashboard
In addition to the typical financial dashboard, some companies go a step further with the implementation of a cost optimisation dashboard.
This type of dashboards are created to develop cost reduction projects and to optimise the organisations' supply chain.
How? Through a dedicated cost optimisation dashboard, companies can check the evolution of their costs, compare them with historical data and analyse the return on investment of all their projects.
By relying on such a dashboard, managers can consider all the variables that affect their financial performance to draw conclusions and create reforming changes.
5. Customer Segmentation Dashboard
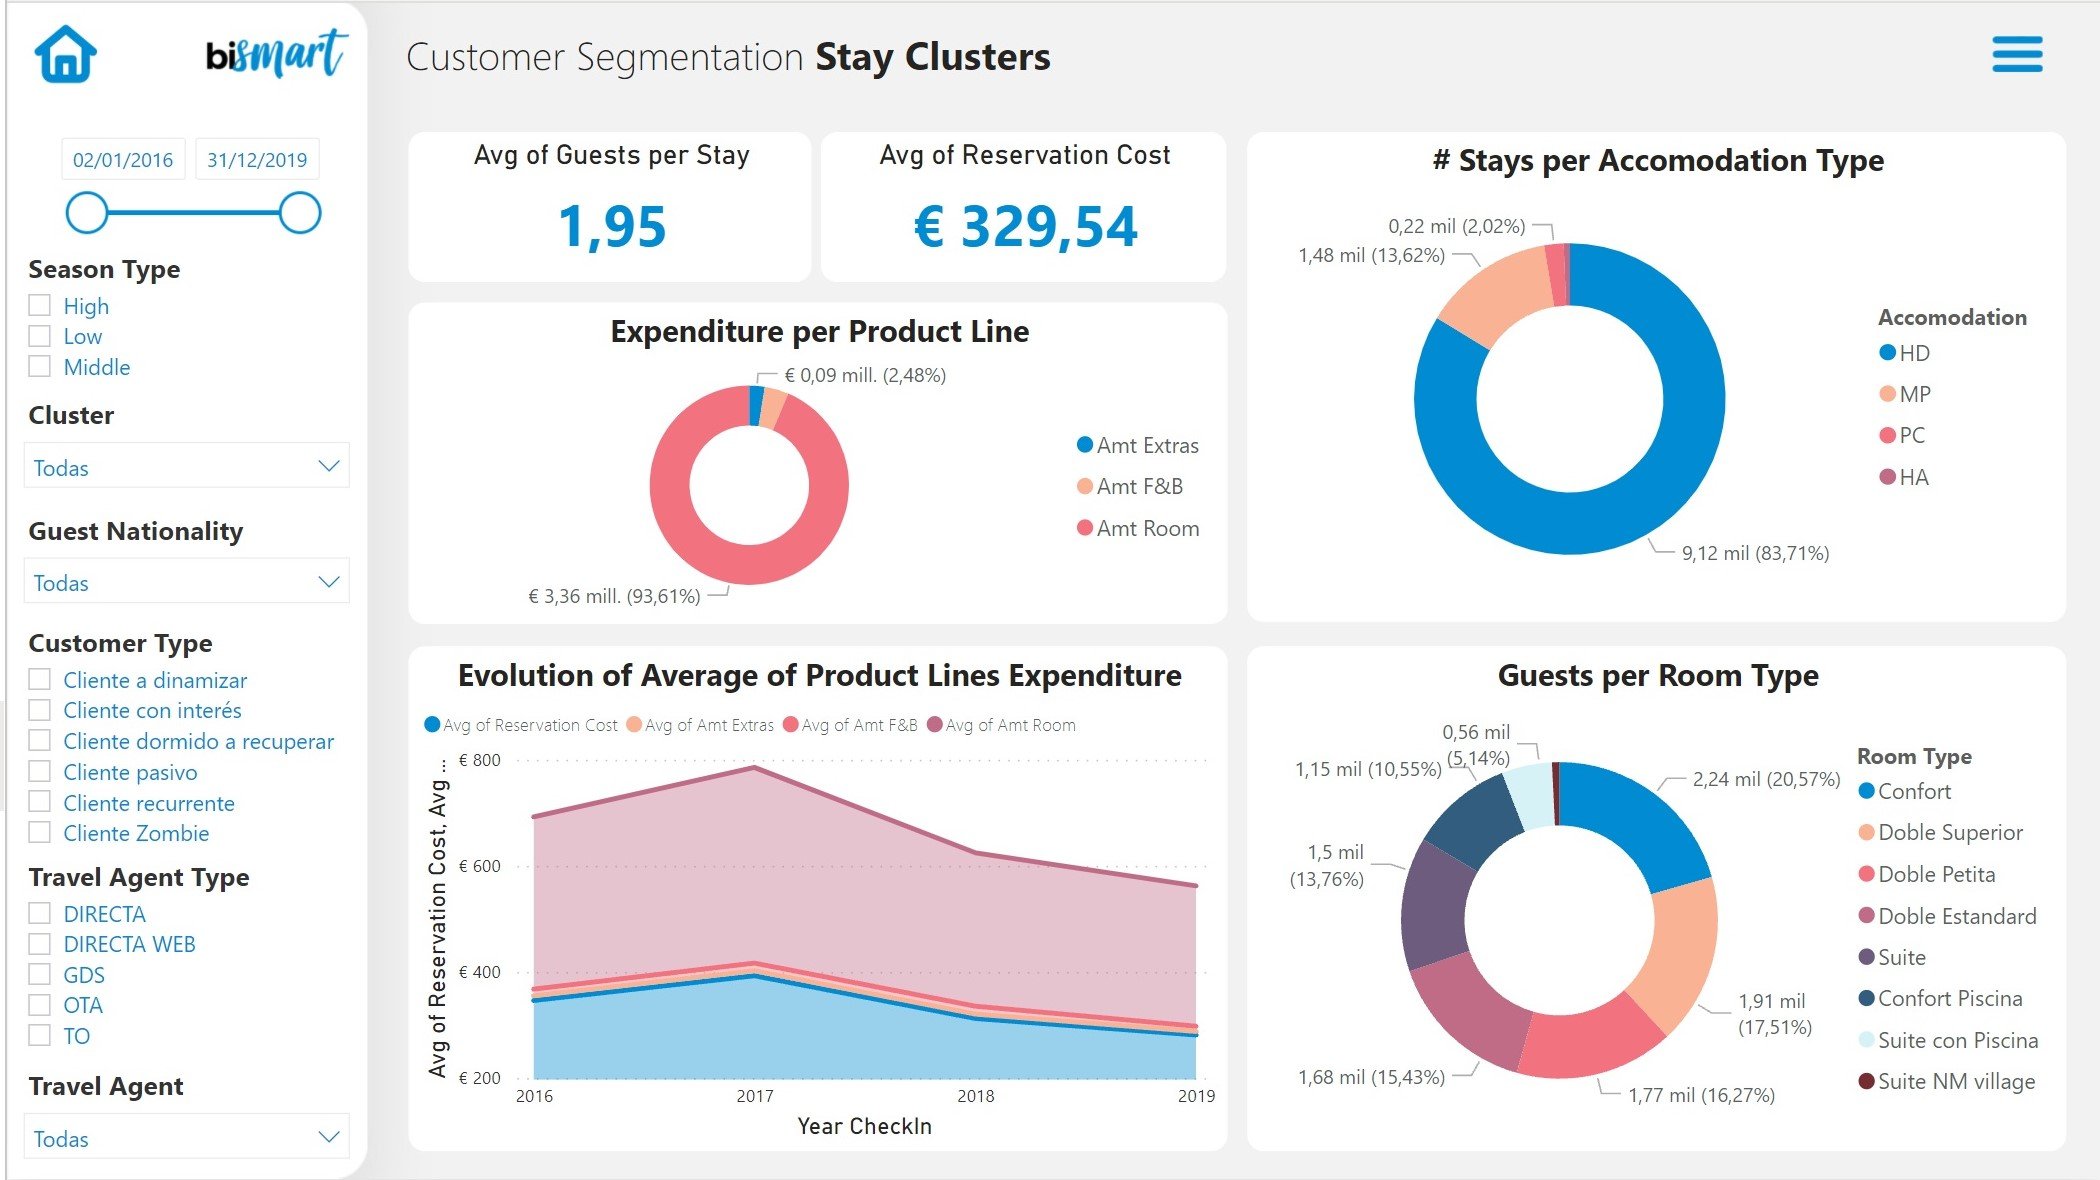
Customer segmentation is one of the most important customer strategies today. Segmentation dashboards allow companies to structure their market and classify customers according to established criteria in order to offer them personalised solutions, products, services and experiences.
Customer segmentation dashboards have gained a lot of relevance in recent years and have positioned themselves as an essential tool for almost every department in the organisation. They allow decision-makers to prioritise and drive actions, decide on which customers to focus efforts and better define actions towards the market.
In addition, these types of dashboards are of great help when it comes to knowing our customers better and identifying pain points, areas for improvement and business opportunities.
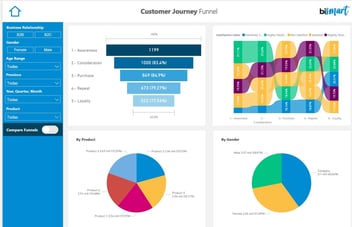
6. Customer Journey Dashboard
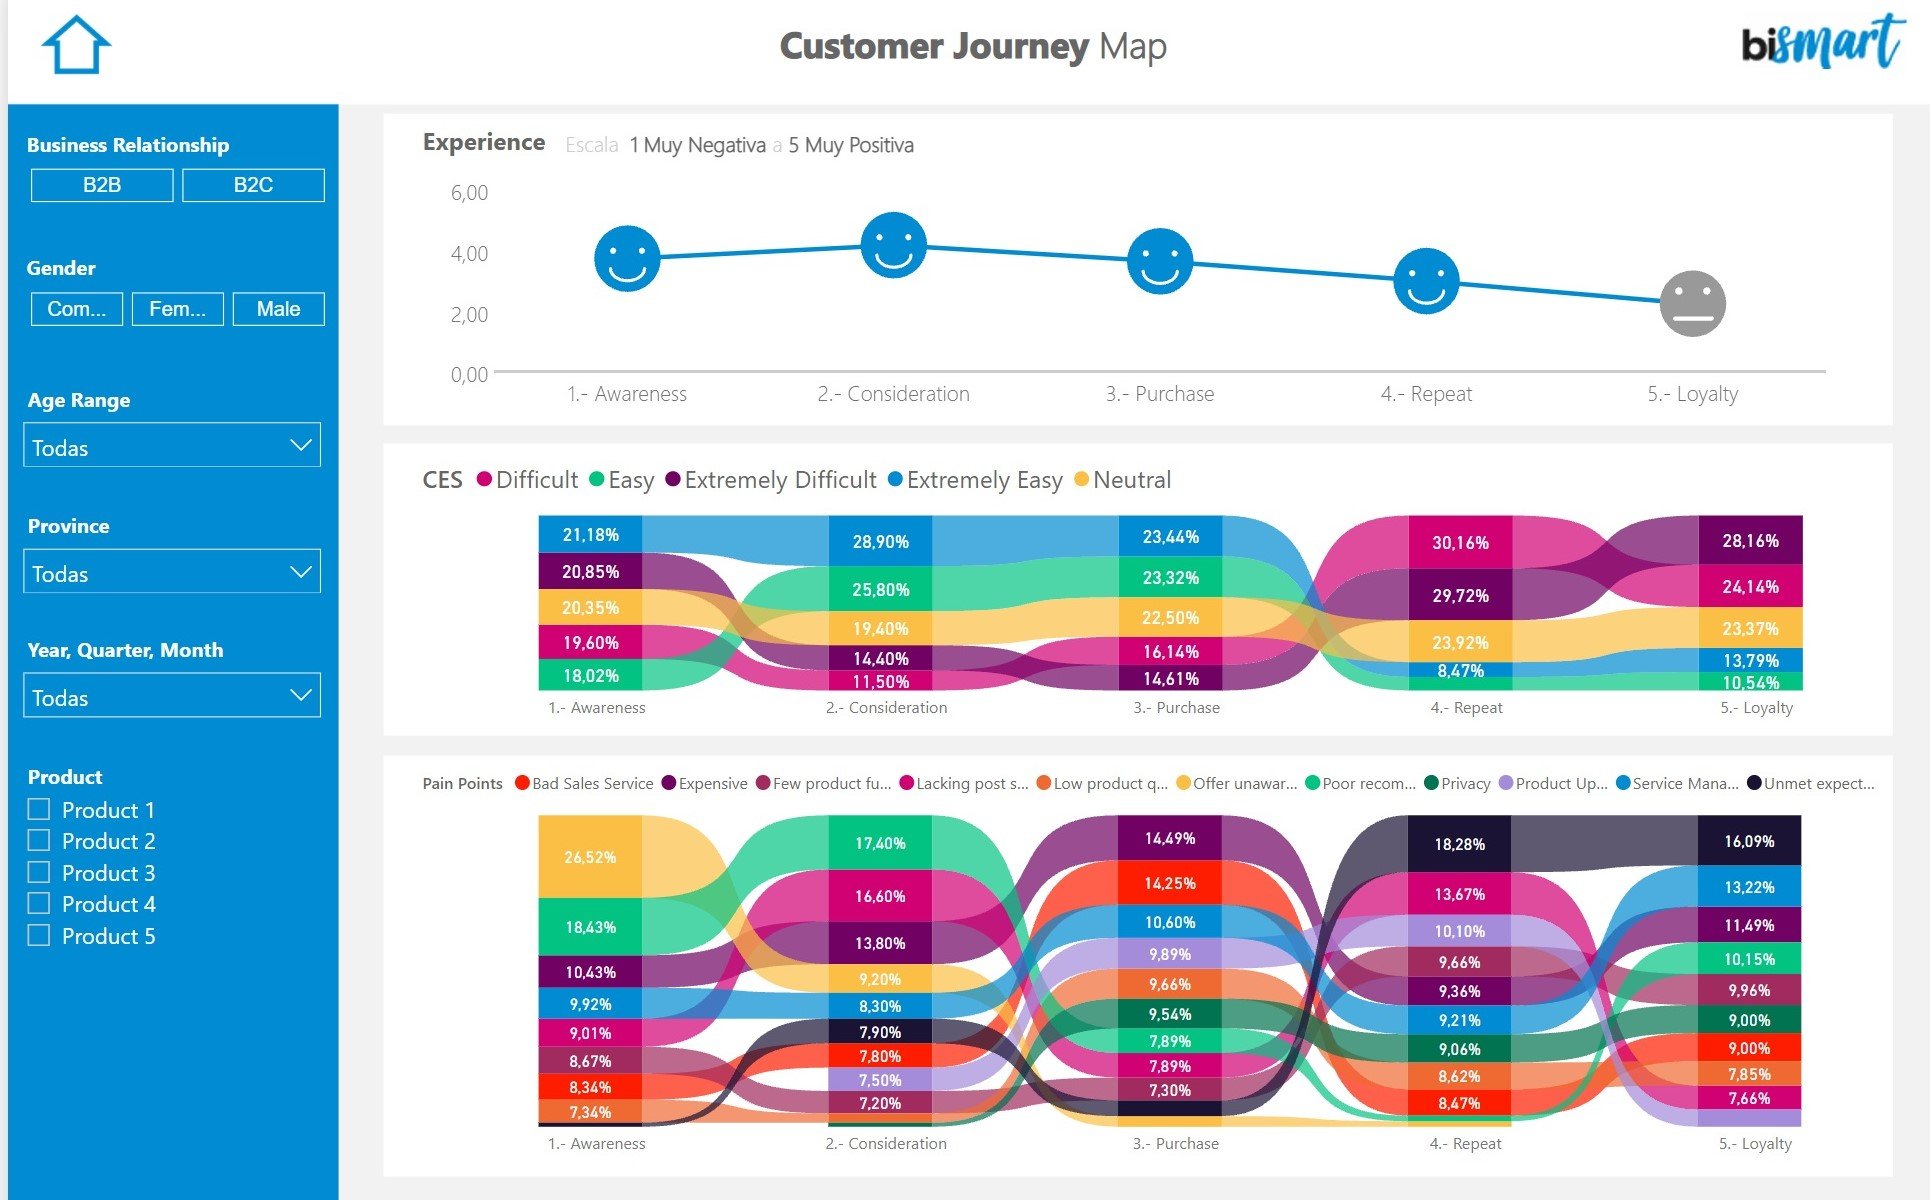
Keeping up with trends in customer strategies, more and more companies are paying attention to the customer journey. Having a map to quantify the customer journey is the best way to improve the customer experience, create personalised acquisition and retention strategies and, ultimately, push customers to the next stage of the purchase process.
A customer journey dashboard should graphically represent the conversion funnel, map the stages of the purchase process and include the most relevant customer journey KPIs.
7. Marketing Insights Dashboard
Today, almost every organisation has a marketing department. The relevance of marketing has been growing along with the digitalisation of the business sector. As a result, marketing dashboards are essential.
Such dashboards monitor the performance of marketing efforts, reflected in marketing campaigns, the success of content generation, lead acquisition, segment performance in each communication channel, and so on.
An effective marketing dashboard should incorporate the most significant insights from the year's marketing strategy and is the primary guide for the company's CMO to measure the success of marketing activities over a given period of time.
8. Social Media Insights Dashboard
Social media has become one of the preferred communication channels for companies. Today, businesses that do not have a specific strategic plan for social media content generation are at a disadvantage.
Social Media Insights dashboards include the most significant metrics related to a company's social media. Obviously, depending on the strategic plan and the social media presence of each business, this type of dashboards will incorporate some performance indicators or others.
However, any social media performance dashboard should serve as the optimal environment to analyse the performance of content and communication campaigns in the digital environment. Studying the behaviour of the audience and the brand-customer relationship on social media can also be decisive if a crisis arises and helps companies to get to know their customers better and to understand the audience's opinion of their products and services.
9. Customer Profitability Dashboard
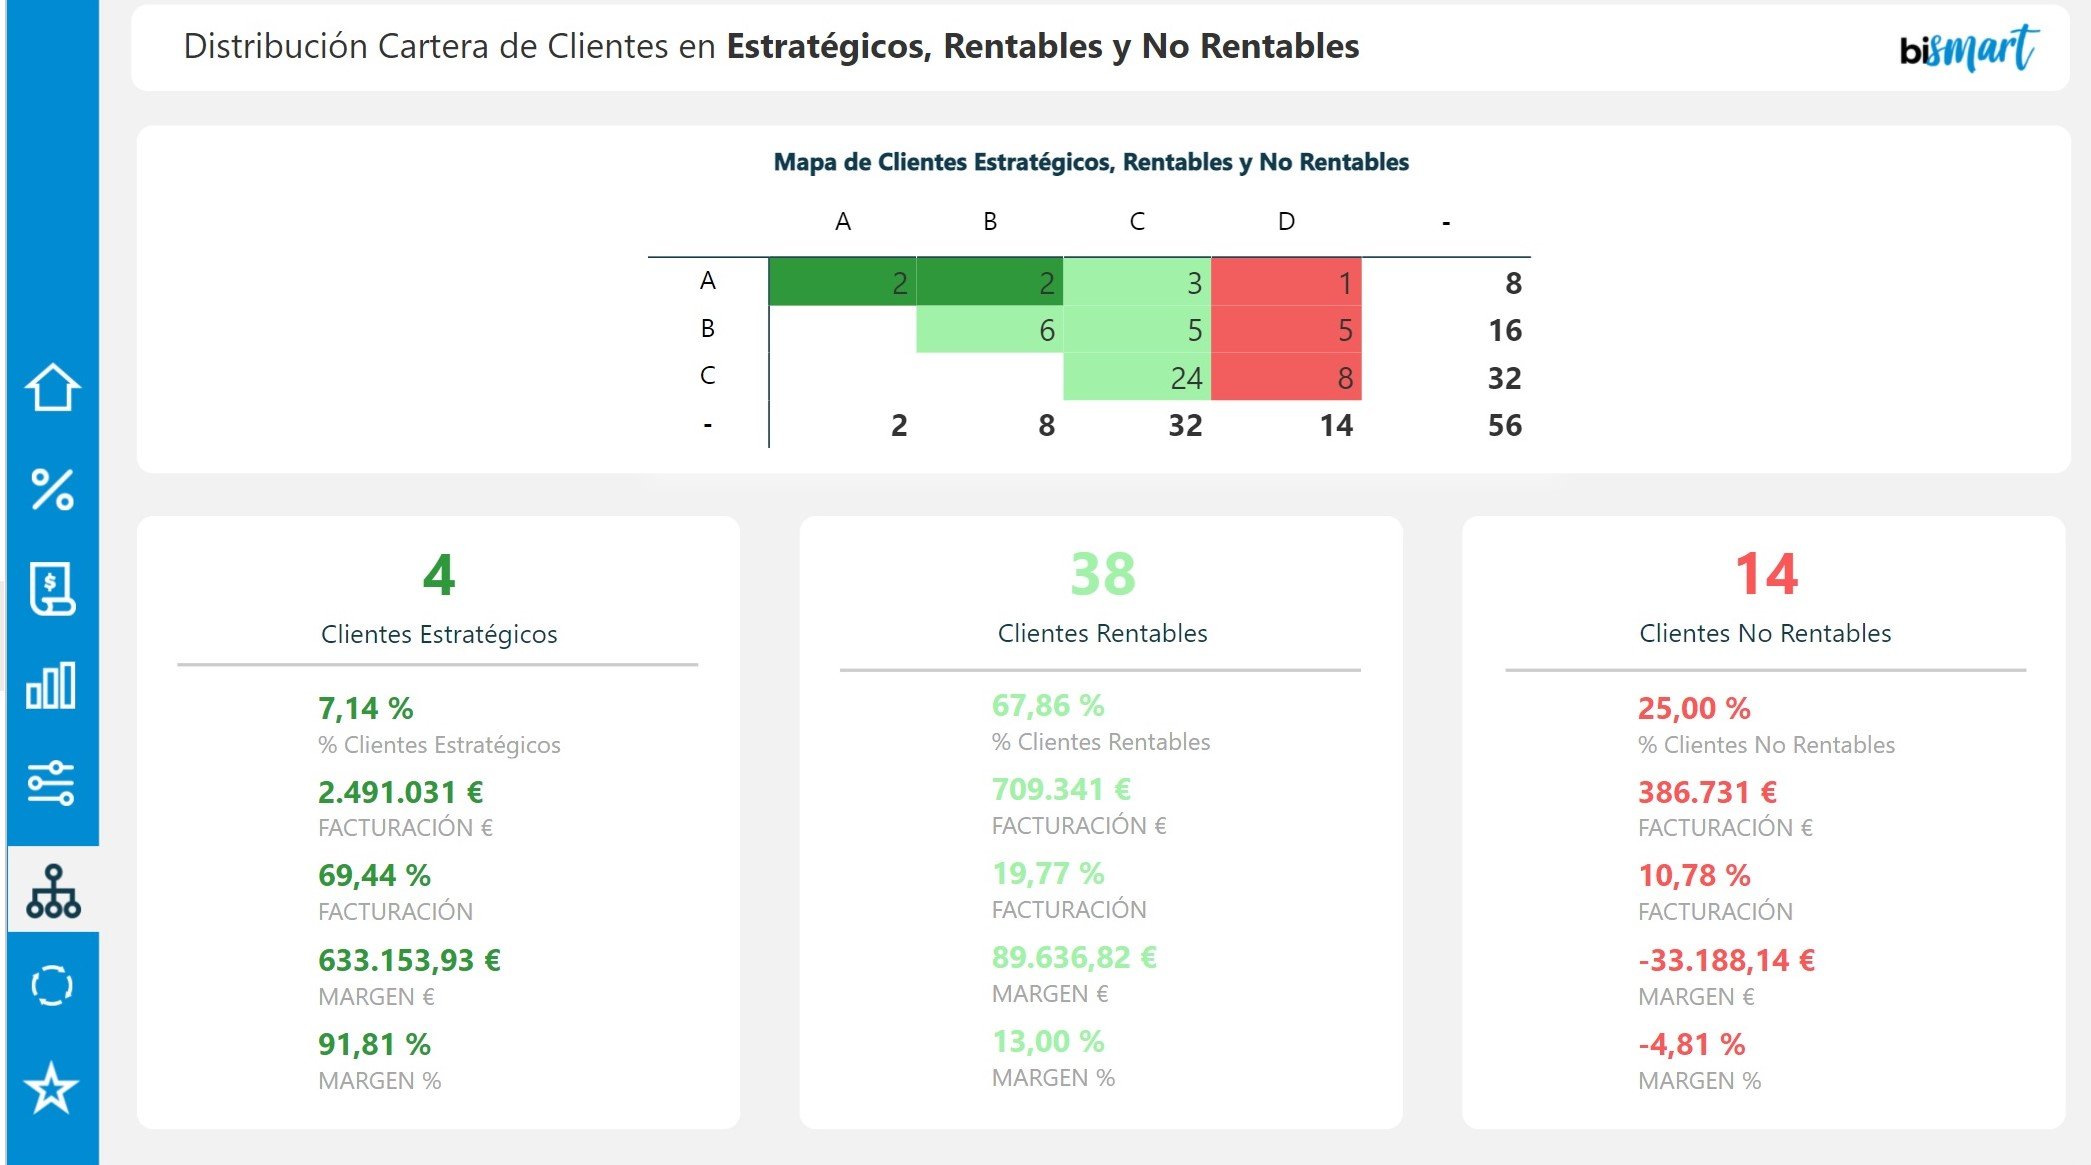
One of the most intelligent and productive ways to segment our customer portfolio is by focusing on each customer's profitability.
In this sense, dashboards oriented to customer segmentation by profitability are positioning themselves as an essential technological solution to help marketing, sales and commercial teams to focus their efforts on the right customers.
This type of dashboard allows companies to align their commercial strategies with customer profitability, as well as to establish their target market, identify strategic customers, discover high-risk or unprofitable customers, and much more. The options are endless.
The ultimate goal of this type of dashboard is to serve as a support tool for customer strategy teams to increase the productivity of their work and help them make better strategic decisions.
10. Hotel Revenue Management Dashboard
The Covid-19 health crisis has had a particularly damaging impact on third sector companies, mainly affecting companies that owe their main source of income to tourism.
The situation has prompted hotel companies to start investing in technology solutions that allow them to monitor their business performance comprehensively in a complex time, to manage crisis and to develop innovation pathways to turn complexity into opportunity.
Hotel Revenue Management Dashboard is a Power BI dashboard that provides a set of information services under a single environment where hotel chain managers and other can consult the indicators of all their hotels and functional areas.
This type of dashboard unifies all of the company's information silos —which are often fragmented— into a single environment to provide a 360° view of business activity.
Thus, Hotel Revenue Management Dashboard integrates all the information that any hotel manager may need: revenue management, purchasing, sales, finances, reputation, staff, economic activity, web traffic, air traffic, etc. It also integrates advanced analytics and predictive analysis and allows managers to predict occupancy, optimise purchases and much more.
In the mood for more?
Download our complete guide 'CEO's Time: The 15 must-have dashboards' and discover 5 other essential dashboards specifically designed for healthcare, utilities, retail and public sector companies.
Bismart offers data analytics and BI solutions tailored to the needs of each business sector. Check out our range of industry-specific solutions.