Get to know the essential 4 types of dashboards: balanced scorecard, executive dashboard, operational dashboard and analytical dashboard.
A dashboard is an essential tool for businesses. However, for a dashboard to fulfil its essential function, it is crucial to adapt it to its public and purpose. We explore the 4 types of dashboards that exist and explain what each one is for.
Companies use dashboards to monitor their business activity and to make data-driven decisions. Thus, dashboards are one of the most important technologies for ensuring the smooth running of a business, along with reports.
As we already mentioned in the article "What Is a Dashboard in Data Analytics and Business Intelligence?", dashboards fulfil an essential function: to graphically represent metrics and performance indicators, as well as to provide a complete and understandable view of one of all the business areas.
However, for a dashboard to be useful and fulfil its purpose, it is essential that it is adapted to its intended audience and consistent with the purpose for which it was created. Depending on their function, their recipients and the type of reality they are intended to explain, there are 4 types of dashboards:
Below, we explain in detail each type of dashboard and what each of them is used for.
Types of dashboards
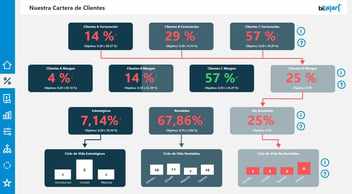
Balanced Scorecard (BSC)
A Balanced Scorecard (BSC) is a type of dashboard used to represent the business activity as a whole. In other words, this type of dashboard should provide a complete picture of a company's overall performance, including the activity of all departments and business units.
Created by Kaplan and Norton in 1992, this type of dashboard is a strategic management and evaluation model that aims to translate the total of elements that make up a corporation's vision and strategy into performance indicators that, in turn, are related to the company's business objectives and action plan.
Download our "Guide to Evaluate Your Company's Performance and Strategic Plan"!
For all these reasons, the balanced scorecard is definitely one of the most significant types of dashboards when it comes to assessing the operability of a company and being able to make intelligent and correct decisions. In this sense, the BSC should include the most relevant performance indicators and KPIs for each functional area.
Its main purpose is to make it easy for the right people to understand how the company is progressing and to analyse the achievement of the established business objectives.
In terms of content and design, the balanced scorecard visually represents data related to business objectives and key performance indicators and should draw a comprehensive map of the strategic business plan, through which senior management can implement the action plan.
A Balanced Scorecard should include:
- A strategic map that outlines the strategic business plan.
- A matrix that encompasses business objectives, performance indicators and KPIs.
- Visual objects and alerts to help judge whether business objectives are being met according to expectations. In the case of alerts, it is common to implement them so that the right people are alerted when an anomaly or performance highlight is detected.
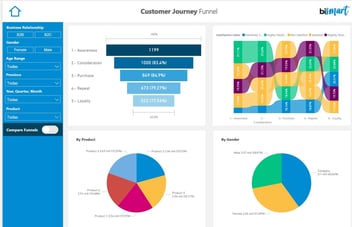
Executive Dashboard
An executive dashboard is a type of scorecard that is specifically designed to enable senior managers to reach conclusions and make decisions efficiently and relatively quickly.
The mission of this type of dashboard is to represent reality clearly, concisely and comprehensively on a single screen. In this sense, while data visualisation and storytelling are essential in any type of dashboard, their relevance is even more significant in this one. Therefore, when designing a dashboard for executives, we must make sure that the information is laid out in the most clear way possible and that its recipients will not have to make a great effort to understand and analyse it.
Unlike the balanced scorecard, an executive dashboard does not necessarily have to represent the entire business activity and can be focused on one of the business areas or on a specific strategy or activity.
One of the big distinguishing features of this type of dashboard is that, unlike other more specific scorecards —such as operational or analytical dashboards— it should not encourage deep data explorations (drill-down approach), but rather the opposite. If the dashboard is well done, senior management should be able to understand the information without having to explore the data sets and the data source. If we present an executive dashboard in a meeting with 10 people, they should all read the same story and come to the same conclusions.
For this to be possible, it is important to focus on data visualisation and to choose the right visuals.
Analytical Dashboard
As the name suggests, an analytical dashboard is a type of scorecard designed to promote analysis and is typically aimed at data analysts, data scientists or middle management. Its purpose is to help data analysts to put data science and data analytics into practice, as well as to serve as a support tool for middle management, especially department managers.
Thus, an analytical dashboard is very different in form and content from a balanced scorecard and an executive dashboard. This type of dashboard is characterised by the use of large data sets, much more information and a more complex structure than the other types of dashboards. At the end of the day, its mission is to encompass all the information necessary for data analysts to do their job: make predictions, compare variables, aggregate and disaggregate dimensions, identify trends, etc.
For all these reasons, historical data, in-depth exploration and comparisons are a must in analytical dashboards. Its users must be able to drill down to the source of the data; compare dimensions, metrics and variables; and explore the history of the data in depth. Therefore, when designing an analytics dashboard, it is essential to encourage interaction and ensure that the information is arranged according to the drill-down model, which consists of displaying the most relevant information in the foreground so that users can explore it in more depth if they wish.
Obviously, due to the professional profile at whom it is aimed, in order to work with an analytical dashboard it is necessary to have a certain level of expertise in data analytics and business intelligence.
Operational Dashboard
Finally, an operational dashboard is a type of scorecard that serves as a support tool to control and track the execution of ongoing business operations.
This type of dashboard primarily includes operational data and performance indicators and typically reflects the most relevant metrics related to the current operations of a particular area of the business. When done well, this type of dashboard should be the main business technology for CTOs to monitor the performance of operations and identify possible anomalies, errors or areas for improvement.
One of its differentiating aspects is that, because it focuses on current operations, it provides a short to medium-term view of reality and helps CTOs to make decisions that are often urgent.
Same as with analytical dashboards, historical data are also extremely valuable in an operational dashboard. However, in this case, the temporal comparisons are short term, usually ranging from a month to a four-month or six-month period.
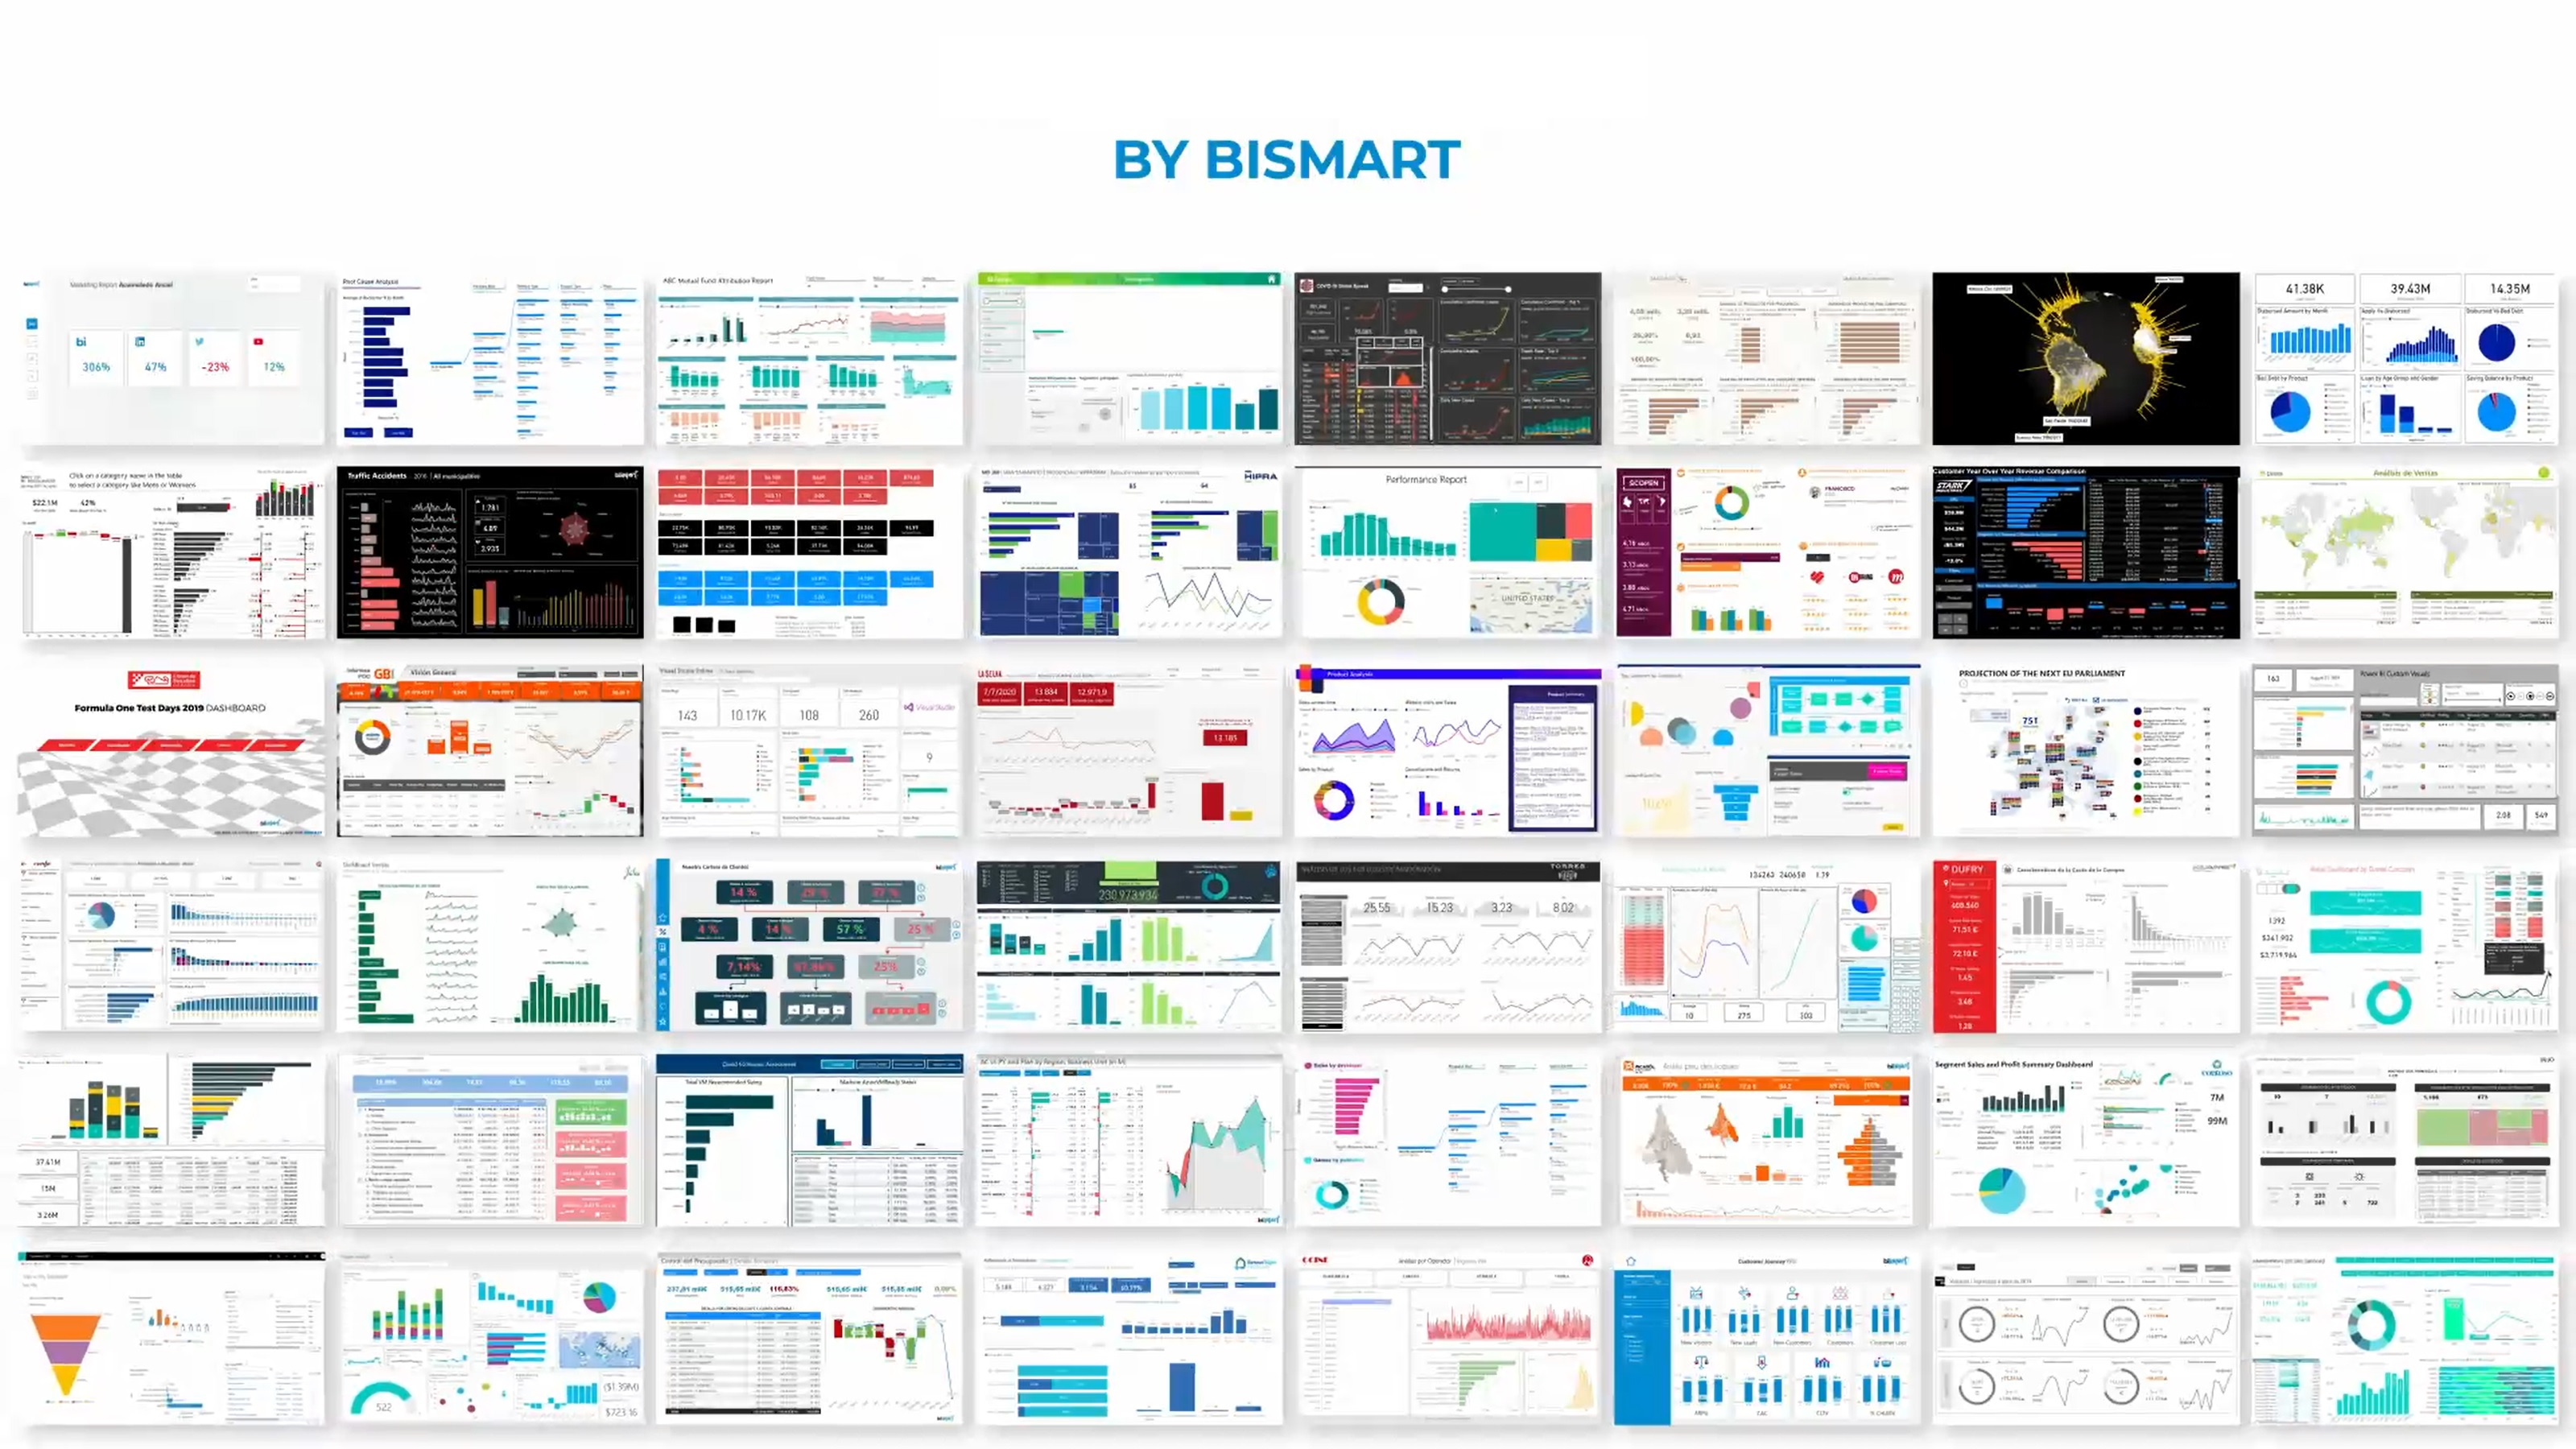
Are you interested in the design and creation of dashboards? At Bismart, as a Microsoft Power BI partner, we develop our dashboards with Power BI. Don't miss the 10 best Power BI dashboards of 2021!
Conclusion
Dashboards are one of the most widely used tools by companies and the role they play is extremely important. They help to make decisions, to monitor the course of business activity and to meet executives' information needs.
Don't miss our Power BI dashboard guide.

Also, you can't miss our "Guide to Evaluate Your Company's Performance and Strategic Plan ":