What is an analytical dashboard? What is it for? Who uses it in within a company? Learn everything you need to know about analytical dashboards here.
Dashboards differ in form and content depending on the business need they are intended to address, their target audience and their purpose. Thus, dashboards can be classified according to their by their function. On this occasion, we talk about the analytical dashboard.

Dashboards are one of the essential tools for the development of a company's business intelligence strategies.
As we discussed in the first post of our types of dashboards series, one of the most effective ways to ensure that a dashboard is useful is to pay attention to its purpose and audience. If we adapt the content, form, design and data reflected in our dashboard to these two factors, we will be able to build dashboards that really do their job: transform data into useful information for the company and foster analysis and data-driven decisions. Likewise, depending on their type, some dashboards are more focused on analysis and generating intelligence and others on driving actions.
The efficiency of a dashboard has a lot to do with communicating the right set of data to the right people. In this sense, depending on their objective, the business needs they aim to solve and who they are targeted to, there are 4 types of dashboards:
- Executive Dashboard
- Analytical Dashboard
- Operational Dashboard
- Educational Dashboard
En la anterior entrega de esta serie hablamos sobre el cuadro de mando para ejecutivos —¿Cómo crear un cuadro de mando para ejecutivos en 6 sencillos pasos?—, y explicamos cómo construirlo. En esta segunda entrega nos fijamos en el cuadro de mando analítico.
In the first part of this series we talked about executives dashboards —How to Create an Executive Dashboard in 6 Easy Steps— and explained how to create them. In this second post we pay attention to analytical dashboards.
What is an analytical dashboard?
Un cuadro de mando analítico es un tipo de dashboard pensado para estimular el análisis. Este tipo de cuadros de mando constituyen una herramienta vital para analistas y científicos de datos, si bien también pueden ser usados por mandos intermedios —especialmente directores de departamento— que deben tomar decisiones y examinar el rendimiento de su área de negocio.
An analytical dashboard is a type of dashboard designed to stimulate analysis. This type of dashboard is a vital tool for analysts and data scientists, but can also be used by middle managers —especially department managers— who need to make decisions and examine the performance of their business area.
Analytical dashboards are often developed by analysts and data scientists as a tool to support department managers or other senior managers. However, unlike the executive dashboard, analytical dashboards typically contain larges amounts of information, large data sets and are more complex and less clear-cut in structure than other types of dashboards.
The major distinctive feature of an analytical dashboard is that, of the four types of dashboards, it is the one that makes the most use of historical data. Comparing and contrasting data across multiple variables is a crucial aspect of data science and data analytics. The purpose of an analytical dashboard is to expose all the information necessary for the right people to identify trends, make comparisons, play with variables and dimensions, and make predictions.
Users of an analytical dashboard must have the ability to compare data over time to, for example, see whether fluctuations in performance are related to corporate action or to other external forces such as socio-economic context, seasonality, etc. Thus, the use of historical data is extremely important in these type of dashboards. Not only do they help business people to understand the present and to discover why their performance is evolving, but they are also essential for forecasting and making future predictions.
Because analytical dashboards incorporate large historical data sets and a considerable amount of information, data visualisation plays a major role. Whereas in the case of executive dashboards, visuals were used to enable senior management to make decisions quickly without having to look at the data; in the case of the analytical dashboard, visuals are used to visually represent large amounts of data that can be queried, combined and explored in greater depth.
- Don't miss: "12 Tips You Can't Ignore When Creating a Dashboard"
Exploration and interaction are crucial requirements for any analytical dashboard. Users must be able to interact with the data and visuals and perform explorations. Therefore, elements such as pivot tables, slicers or drill-downs are very useful in this type of dashboard.
An analytical dashboard is a more complex tool than other types of dashboards and requires a level of understanding and knowledge of data, statistics and analytics that the average business worker is unlikely to possess. The data in an analytical dashboard is often complex, as are the analysis exercises for which it is designed. Precisely for this reason, it is advisable that this type of dashboard is reserved for the most analytical and scientific profiles of the company through, for example, user permissions. With this simple method, we ensure that only the users who must consult and work on the dashboard can do so.
Want to manage your users' access to all corporate dashboards, add restrictive measures and manage enterprise-wide activity in Power BI? Find out how with Power BI Viewer and Power BI Analytics.
Conclusion
Undoubtedly, reflecting on the business problems we want to solve, the objectives we want to achieve or who a dashboard is aimed at is an essential prior step before designing it and modelling the data.
This time we have explained what an analytical dashboard is, what it is for and what profiles within the company use it. Over the next few weeks we will do the same with operational dashboards and educational dashboards. Stay tuned!
Lastly...
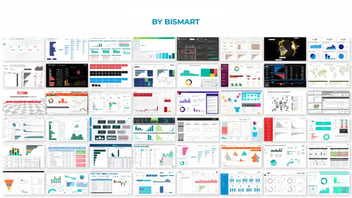
Are you interested in creating efficient business dashboards in Power BI? Download our e-book with the 15 best Power BI dashboards of 2021!