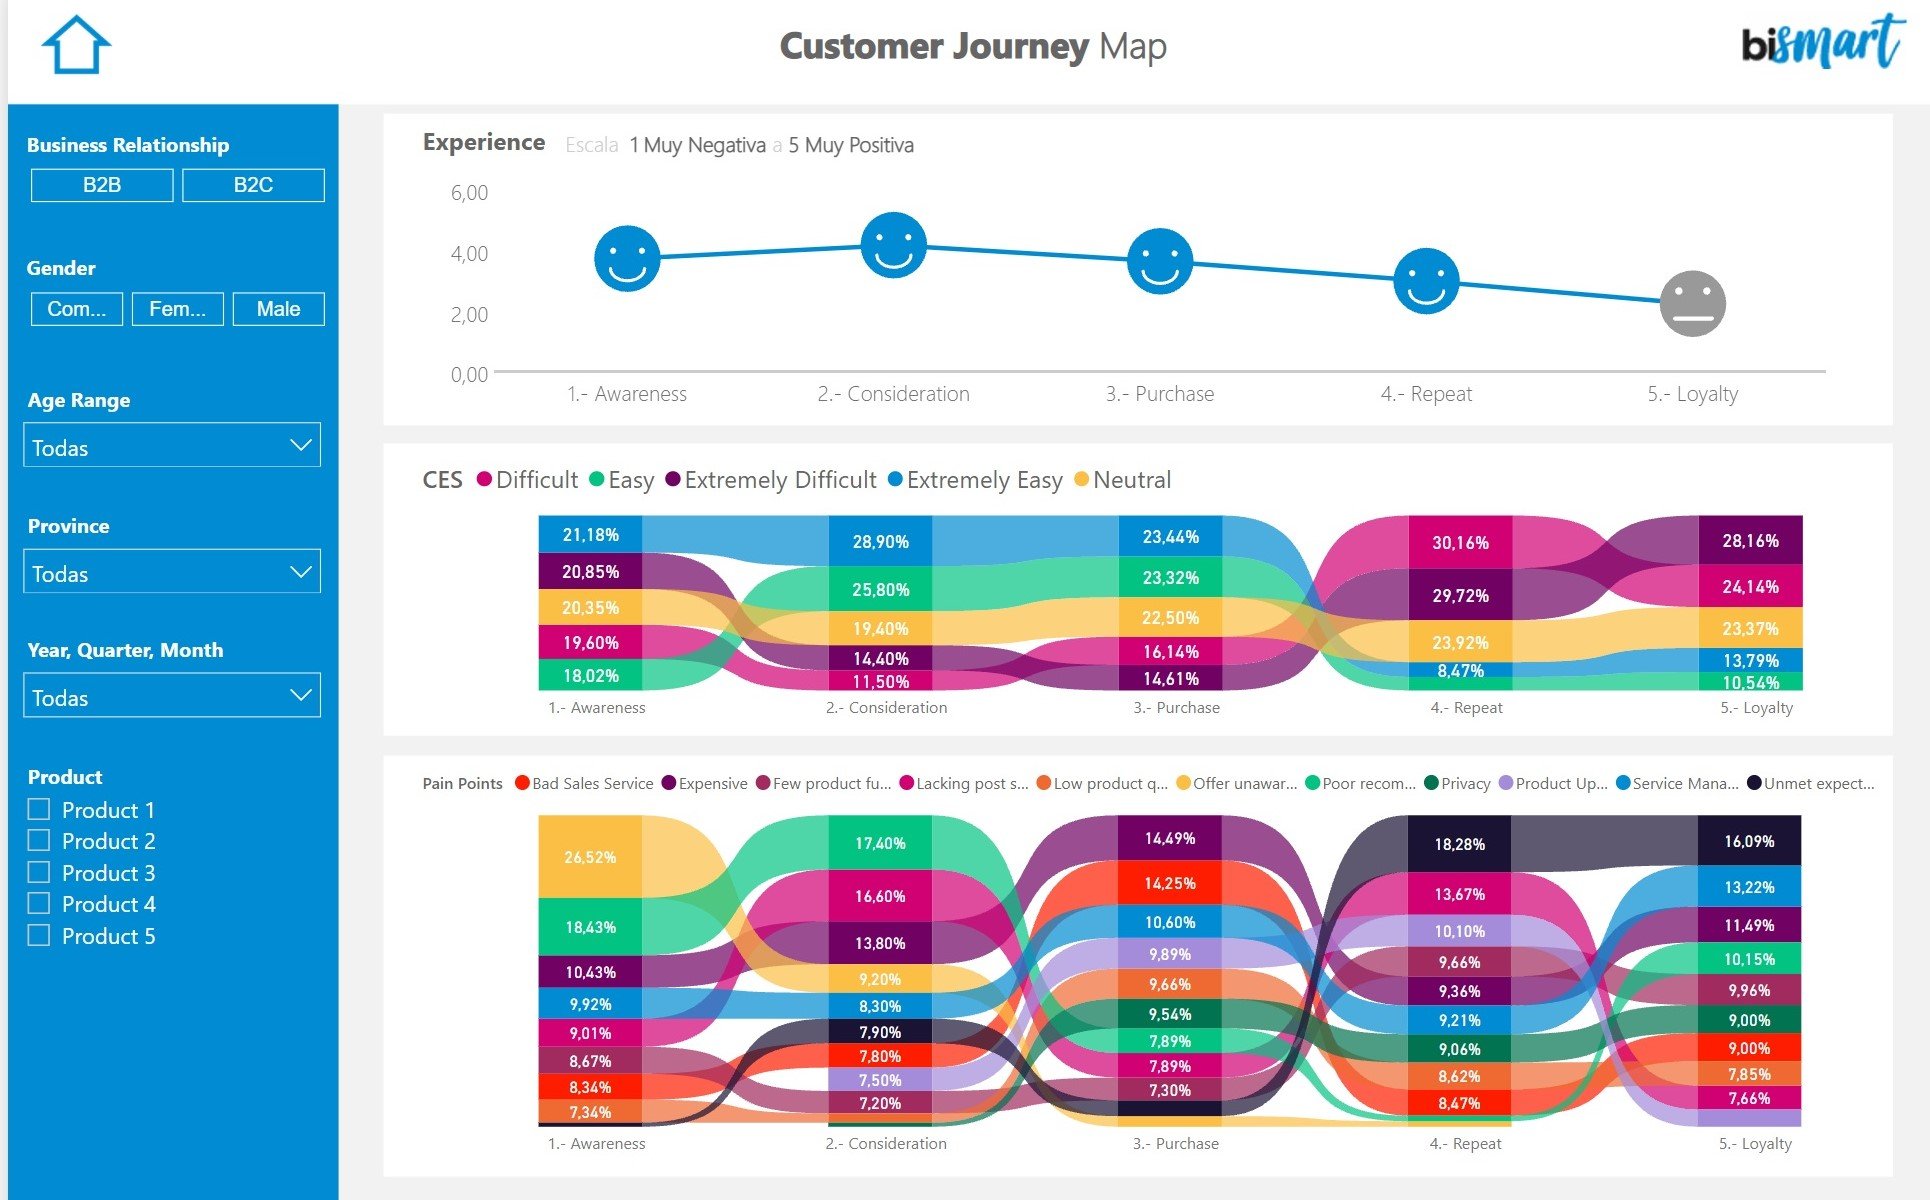
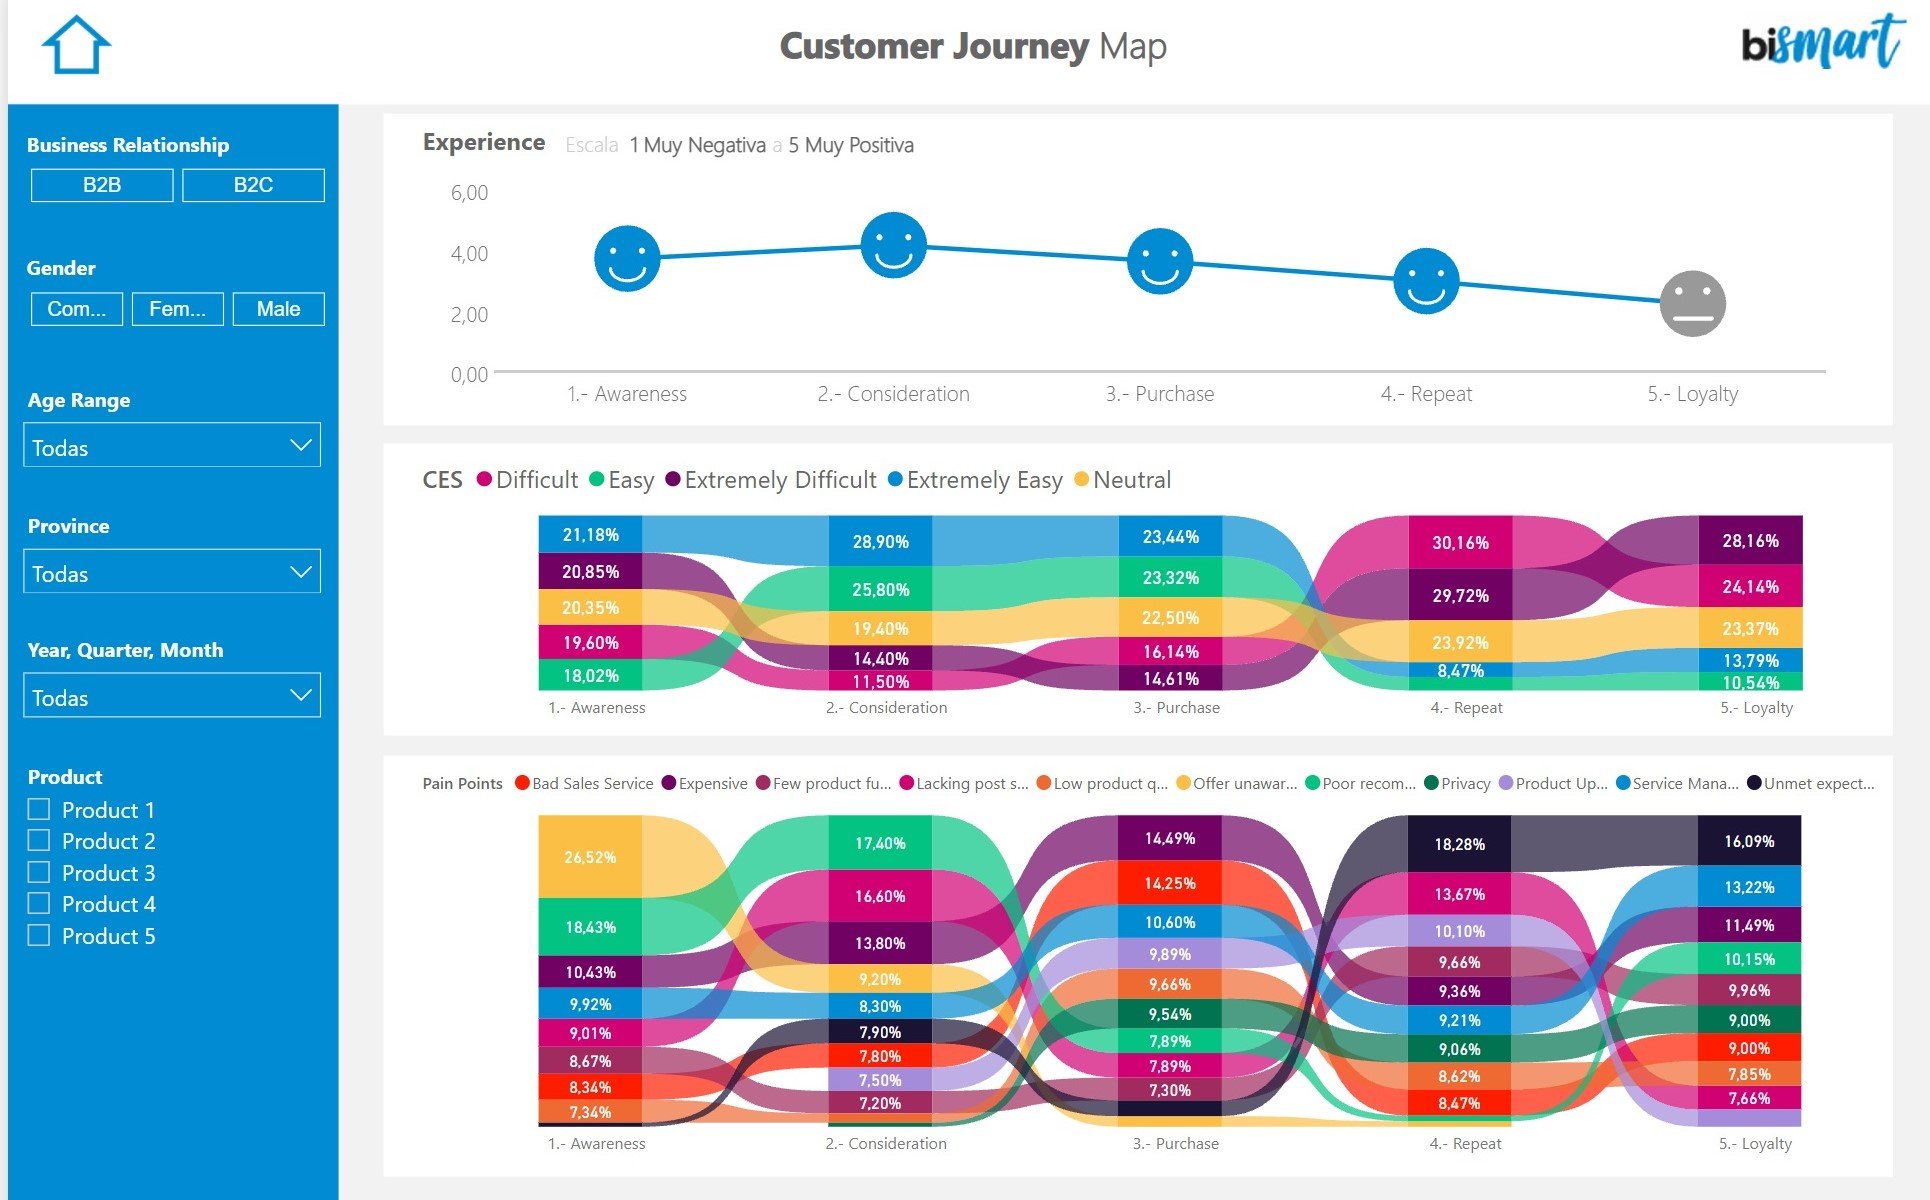
Power BI is one of the best tools for data visualization. Learn how to use Power BI for data visualization and what are the perks of Power BI visuals.
Nowadays, data analysis is a requirement for any company that wants to be competitive, know its customers and make data-driven decisions. In this sense, having access to the data is no longer enough, but it is also fundamental to analyze it and create visualizations that promote its understanding.

Today, there are a large number of tools designed for data analysis and the creation of reports and graphs. Choosing the right tool is extremely important, since not all of them have the same capabilities and, depending on which one we choose, the result will vary. The quality and readability of our visualization will depend on the tool we use and, therefore, it is vital to choose an application that suits our needs.
Bismart is committed to Power BI, a predictive and intelligent system that has the capacity to transform the most complex data into visualizations or reports with attractive designs that promote understanding and legibility. As a Power BI partner of Microsoft, Microsoft backs our expertise in data visualisation using Power BI and ensures that we use the best Power BI visuals for our reports and dashboards.
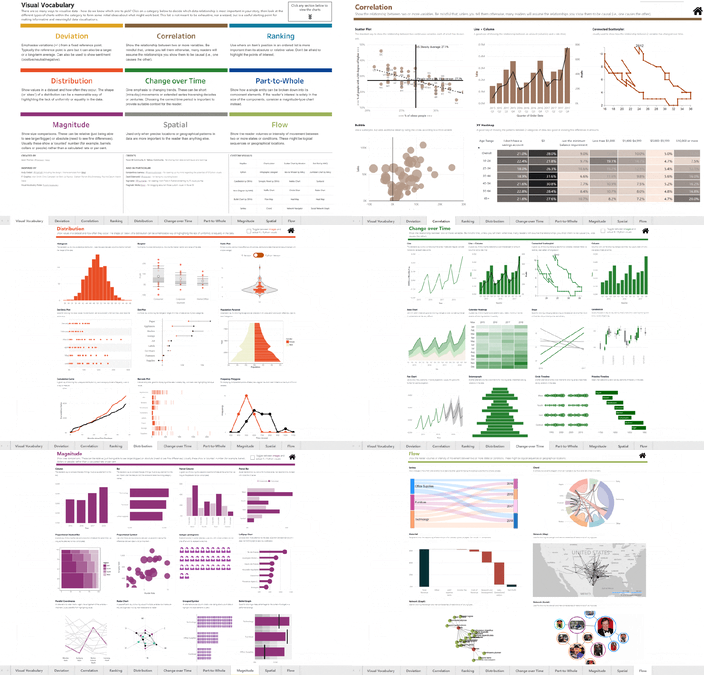
Our experts in data visualization with Power BI have helped in the creation of an e-book that compiles the best Power BI dashboards of 2023.
What is Power BI?
Power BI is a set of cloud-based tools that allow companies to access, analyze and understand data and, therefore, to make data-driven decisions. In fact, Power BI was created as an application designed for business analysis and enables access to data from practically any device. Furthermore, the data is accessible and can be shared by any worker in the company and it is updated in real time.
Power BI includes three programs:
- Power BI Desktop: A free desktop app that allows the transformation and visualization of data, as well as the creation of reports.
- Power BI Service: This online service (SaaS) has similar capabilities to the desktop application, but it also allows the updating of data in real time so that users can check the updated information at any time, as well as publish and share it.
- Power BI Mobile: Power BI also has an application through which reports can be viewed from iOS, Android and Windows mobile devices.
This set of tools includes the usual techniques such as forecasting, adding and quick measurements, as well as more advanced techniques such as DAX formula language that gives absolute control over the model. In addition, it also has artificial intelligence functionalities, with no need for code, so that otherwise inaccessible information can be gathered.
Power BI also provides different types of capacities according to the Power BI license each company has.
Why should you use Power BI for data visualization?
Power BI's main benefit is that it is one of the data visualization platforms that allows the development of better information presentations and designs —whether they are charts, reports or others—, as well as it includes integration capabilities and guarantees the security of the data. In other words, this set of applications enables the development of interactive graphic representations that promote the understanding of the information, that are visually impressive and interesting and can be easily shared. In addition, Power BI allows the personalization of all panels and reports and includes a data security and data governance system that protects the information and facilitates data management and data governance.
Another competitive advantage of Power BI is that it encourages data integration, since it has the capacity to collect data from many sources and in any format -either from a local software or digital platforms-. For example, it has access to both relational and non-relational databases, Excel, CRM, Azure and SQL files, or even web applications such as Google Analytics or Google Ads.
Power BI is also the only visualization tool that integrates with Zebra BI, a data visualization and reporting software that provides advanced and innovative visuals for Power BI and Excel.
In short, the benefits of Power BI are:
- Connectivity: Power BI has the ability to import data in any format and stored in any data source. In addition, it facilitates the transformation and crossing of data from different sources in a single view.
- Sharing: As an application stored in the cloud, Power BI makes it easy for reports to be shared with employees and with customers. This makes it easier for all departments to be connected and to consult each other's reports, promoting cooperation between different business areas and joint strategies.
- Transversal utility: Another key aspect of this tool is that it is functional and useful for all the departments of a company. The creation of dashboards is adapted to the requirements and needs of each department, and it improves the overall business activity.
- Real-time updating: Data is updated automatically. This way, companies are able to make real-time decisions.
- Price: Power BI Desktop and Power BI Mobile are totally free. Power BI Pro, on the other hand, os a monthly payment tool which also allows to create collaborative spaces, has superior security measures and more storage capacity.
How to use Power BI for data visualization?
Using Power BI for data visualization is a straightforward process.
Here's a step-by-step guide on how to use Power BI for data visualization:
-
Install Power BI Desktop: Start by downloading and installing the Power BI Desktop application from the official Microsoft website. This is a free tool that allows you to create reports and dashboards on your local machine.
-
Connect to Data Sources: Launch Power BI Desktop and click on "Get Data" in the Home tab. You can connect to a wide range of data sources such as Excel files, databases, online services like SharePoint, SQL Server, Azure, etc. Choose the appropriate data source and provide the necessary credentials or file path.
-
Transform Data (optional): If your data requires any cleaning, transformation, or merging, you can use Power BI's Power Query Editor to do so. Power Query is a powerful tool for data preparation and shaping.
-
Create Visualizations: Once your data is loaded, you can start creating visuals. Power BI provides a vast array of visualization options, including bar charts, line charts, pie charts, maps, tables, matrices, etc. You can select a visualization type from the "Visualizations" pane and drag and drop the fields from the data model to the appropriate areas (e.g., Values, Axis, Legend) to build the visualization.
-
Add Filters and Slicers: Power BI allows you to add filters and slicers to your reports. Filters allow users to control what data is displayed in the visuals, while slicers provide a way to interactively filter data across multiple visuals.
-
Create Relationships (if needed): If your data comes from multiple tables or data sources, you may need to create relationships between the tables to enable proper data aggregation and visualization. You can do this by defining relationships in the "Model" view.
-
Format and Customize: Customize your visuals, adjust colors, fonts, and styles to make your report visually appealing and easy to interpret.
-
Add Calculated Measures (if needed): Power BI allows you to create new calculated measures using DAX (Data Analysis Expressions) to perform calculations not available in the original data.
-
Create Dashboards: After creating individual visuals, you can group them together in a dashboard. Dashboards provide a unified view of your data and allow you to organize and present your insights effectively.
-
Share and Publish: Once you have built your report and dashboard, you can save the file and share it with others using Power BI Service. You can publish the report to the cloud, and others can access it through the web or mobile app.
Remember to regularly refresh your data to keep the visualizations up to date with the most recent information.
Power BI has a robust community and extensive documentation, so you can find plenty of tutorials, videos, and forums to help you with more specific features or advanced techniques.
What can Power BI do for my company?
In today's world, data analysis is a competitive advantage for any business and, in fact, it has become a necessity. Having quality data that is well-analyzed, allows companies to discover their strengths, their pain points and inefficiencies, take data-driven decisions, be aware of opportunities and predict future scenarios. In addition, data analysis is fundamental to develop customer-centric strategies and to improve user experiences. In short, it is a practice that must be present in all departments of a company: in the marketing area, in the commercial area, logistics, operations, human resources, etc., to ensure the optimal functioning of the company as a whole.
For all these reasons, Power BI is a key tool, since it is not only capable of analyzing data, but it also achieves models that are not very visible. Also, Power BI facilitates businesses to reach reliable conclusions and, therefore, make better decisions and develop more effective business intelligence strategies.
In Bismart, as a Microsoft Power BI partner, we have experts who have a large experience using this tool. If you want to discover our Power BI solutions you can check our website.
If you haven't downloaded our most recent e-book with the 15 best Power BI dashboards available, download it now!


