
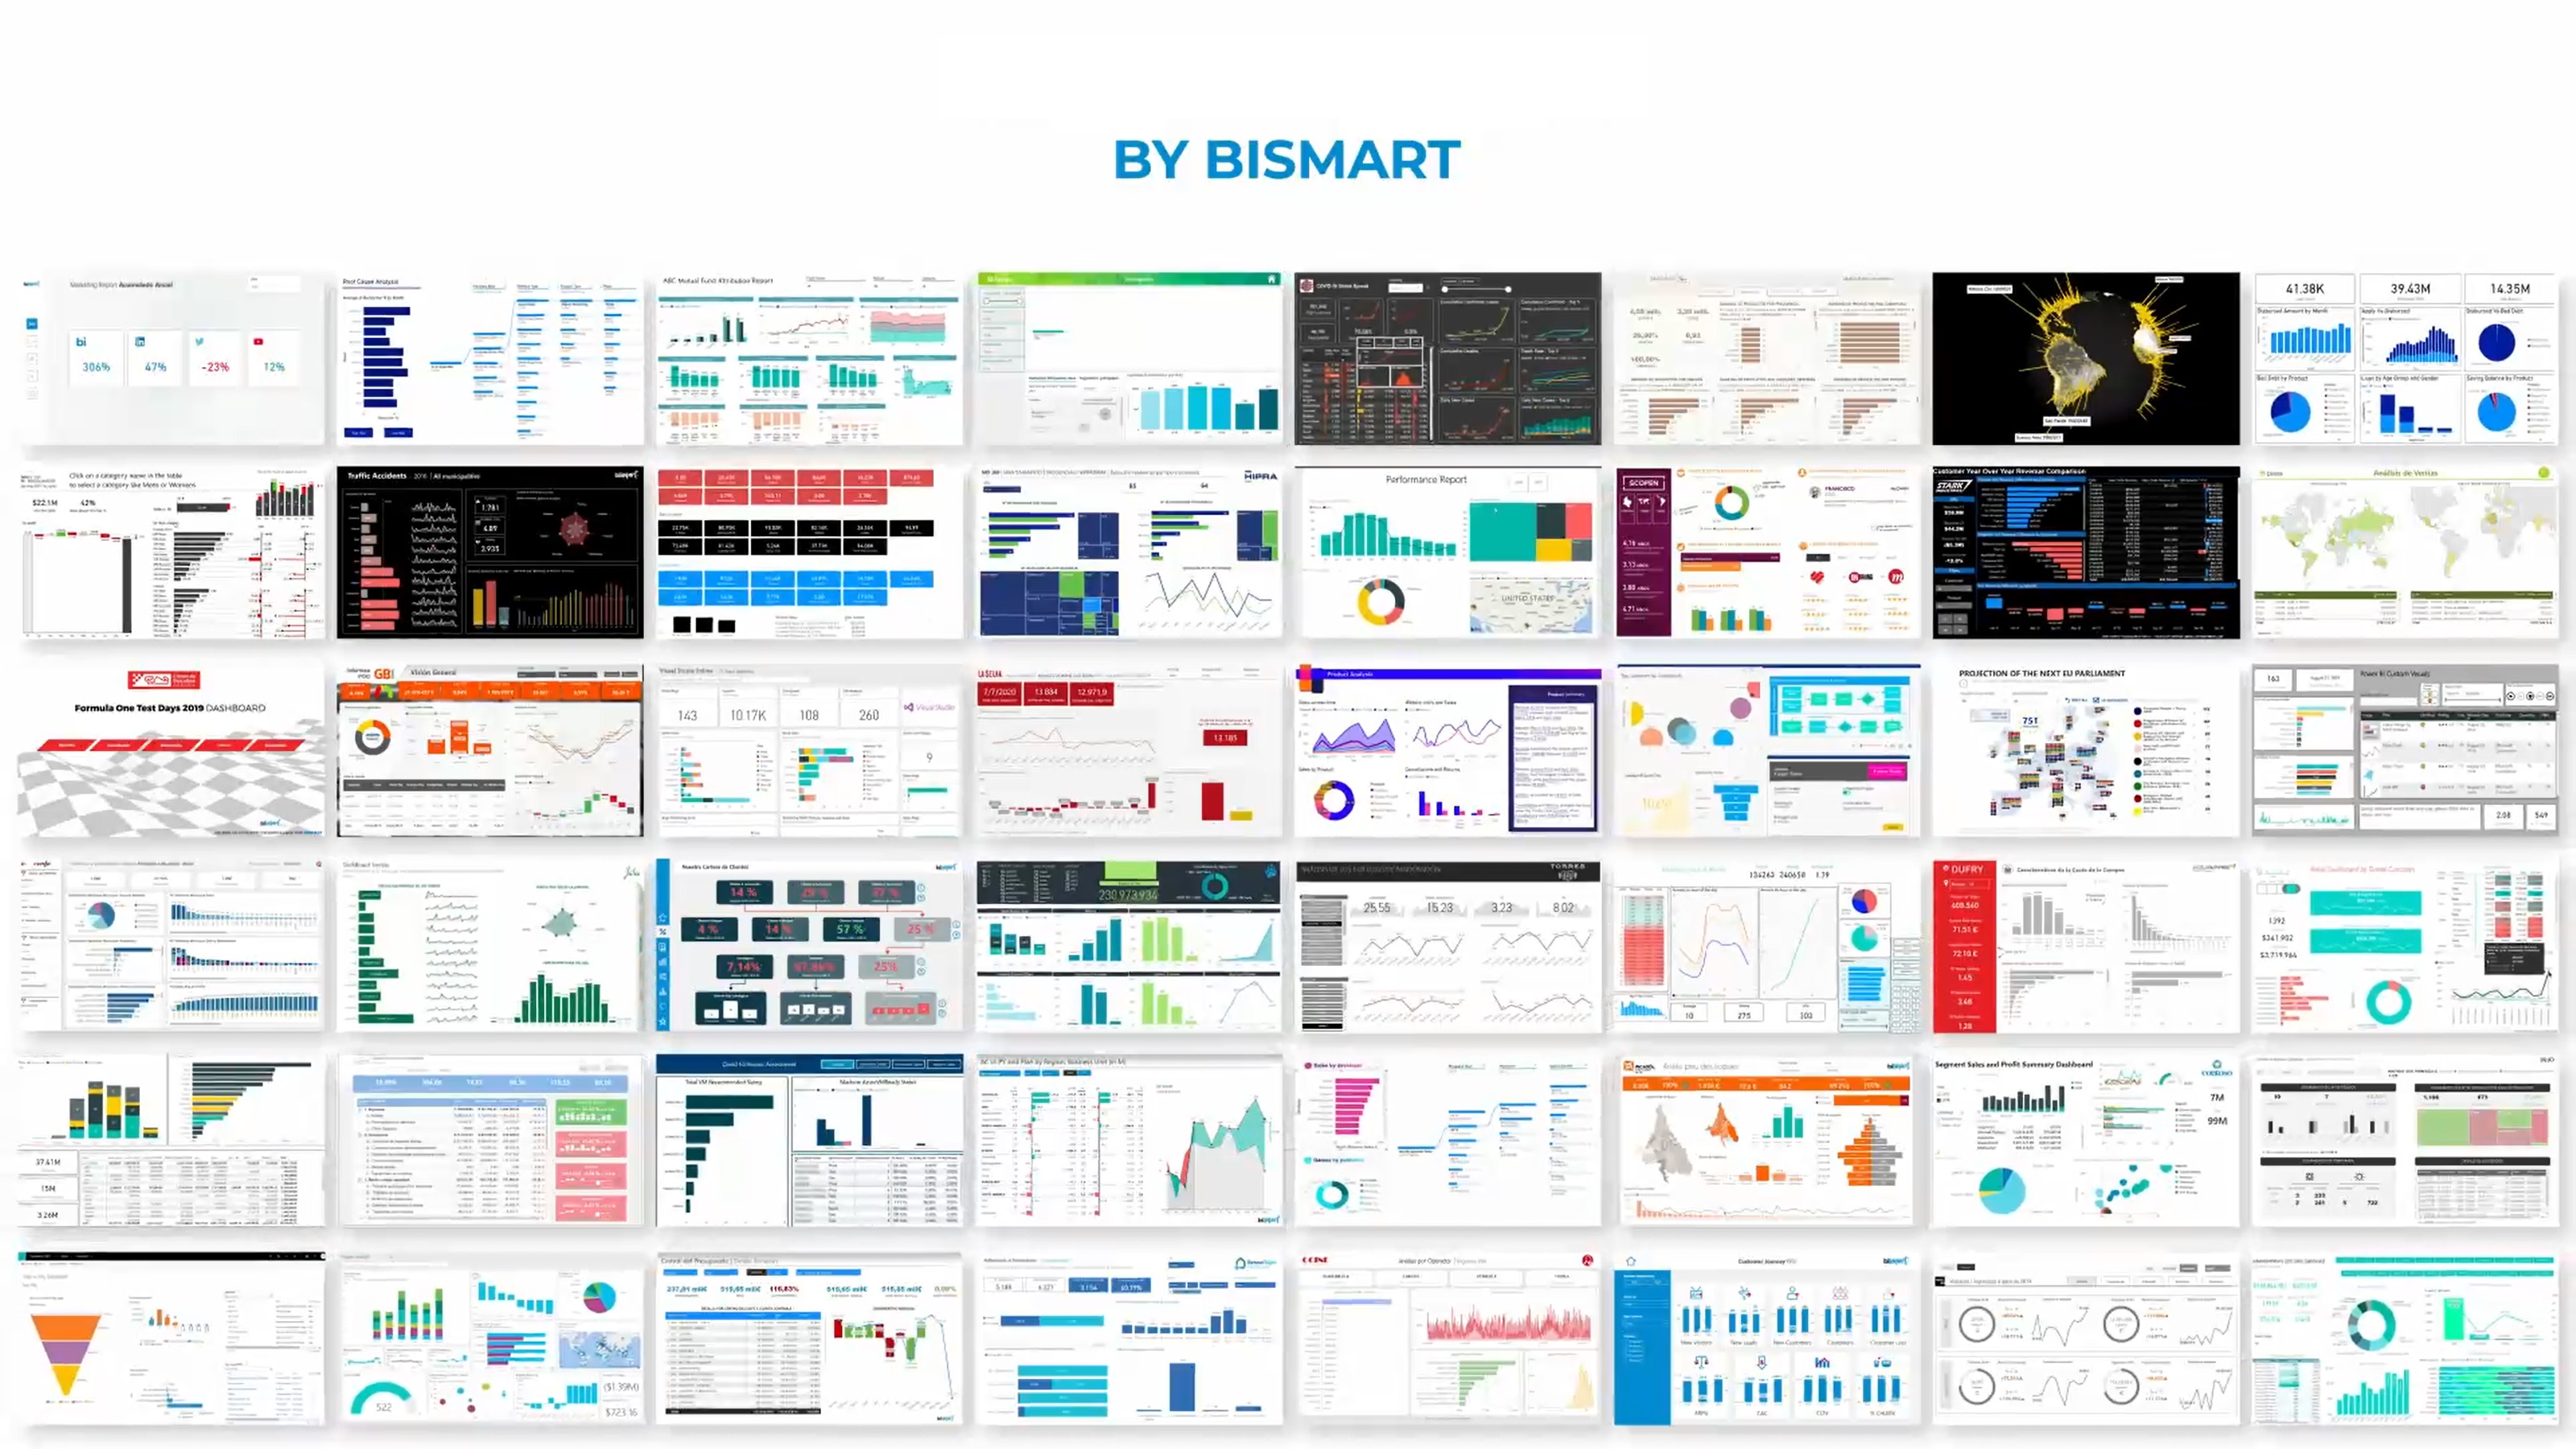
Introducing the 15 best Power BI dashboards of 2023. Find out which metrics they include by downloading our e-book!
As technology advances and business needs evolve, so do corporate dashboards. Business Intelligence tools are enabling the creation of more and more sophisticated and powerful dashboards. This time, we present the 15 best Power BI dashboards of 2023.
At the Bismart blog we try to keep our readers up to date with all the latest Power BI news. As a preferred Microsoft Power BI partner, we have a team of experts specialised in this tool and use it in our solutions.
A few years ago, we listed the top 10 Power BI dashboards for 2021, but technology is constantly evolving. So our team of Power BI experts has put together an e-book with an updated list of the 15 must-have business Power BI dashboards for 2023. Don't miss it!
One of the most common uses of Power BI is the creation of dashboards, as they are essential tools for monitoring and analysing business performance. Dashboards —also known as control panels— are a fundamental part of the process of transforming data into information through data visualisation and storytelling. Their ultimate goal is to guide executives in making data-driven decisions. Therefore, they present the results of data analysis in an attractive and understandable way, facilitating the understanding of key performance indicators (KPIs).
Without reliable, quality information, making efficient decisions becomes almost impossible. Power BI offers a wide variety of dashboard creation and design options, allowing companies to customise dashboards and tailor them to their needs.
Organisations often require multiple dashboards to study and monitor different business areas, departments, projects or campaigns. Over time, some dashboards become outdated and are replaced by others more suited to the demands of an increasingly digital, multidimensional and technological market.
For this reason, our team of business intelligence experts has defined the 15 best Power BI Dashboards for 2023, listed below.
We have also put together an e-book with the 15 must-have Power BI Dashboards for 2023. Download the e-book to see examples of the 15 best Power BI dashboards, as well as a detailed explanation of what they are for and what metrics they should include. Download e-book
Top 15 Power BI Dashboards 2023

1. Balanced Scorecard (BSC)
The Balanced Scorecard (BSC) is the most important type of dashboard for any business. It is a specialised tool used to represent and assess business activity in its entirety. Its main objective is to translate the key aspects that make up an organisation's strategy and mission into a set of performance indicators. These indicators, in turn, form part of a strategic management and measurement system that allows companies to measure and monitor the strategies and actions implemented to improve their performance.
Unlike a conventional scorecard, the BSC covers all aspects related to a company's strategic and action plan. In the balanced scorecard, these aspects are represented through performance indicators and KPIs (Key Performance Indicators). From a balanced scorecard perspective, all performance indicators must be linked to a specific business objective, which is part of the organisation's strategic plan and action plan.
2. Financial Dashboard
Financial dashboards continue to be an indispensable tool in the business world. These dashboards are responsible for integrating an organisation's most relevant financial indicators and play a crucial role in ensuring that the financial health of the business is on track.
It is important to note that the metrics and performance indicators in a financial dashboard may vary depending on the nature and logic of each company. However, any financial dashboard will include the basic metrics, such as projected and actual revenues, net profits, projected costs and actual costs, as well as the income statement.
In addition, it is essential to keep in mind that financial dashboards not only provide a clear view of the company's current financial situation, but also allow for forecasting future spending and revenues to make more informed financial decisions.
Financial dashboards are probably the least advanced type of dashboard in terms of technology and data visualisation. The reason is simple: financial information is complex, not very flexible and difficult to represent visually. However, there is a tool, Zebra BI, specially designed for the visualisation of financial data in Power BI. Zebra BI contains the best financial visuals for Power BI on the market and makes it easy to democratise a type of data that is difficult to understand.
3. Cost Optimisation Dashboard
In addition to traditional financial scorecards, some companies are taking financial analysis a step further by implementing a specific dashboard for cost optimisation.
These dashboards are designed for the purpose of developing cost reduction projects and improving supply chain efficiency in organisations.
Through a dedicated cost optimisation dashboard, companies can monitor the evolution of their costs, compare them with historical data and analyse the return on investment of all their projects.
By adopting such a dashboard, executives and managers can address all the variables that impact the company's financial performance, enabling them to draw meaningful conclusions and promote transformational change. These scorecards provide a holistic view of costs and allow them to identify areas for improvement, optimise resources and make sounder strategic decisions.
4. Marketing Insights Dashboard
Today, it is common to find marketing departments in almost every organisation. The importance of marketing has increased as the business sector has become increasingly digitalised. In this context, marketing dashboards have become an essential tool for any company.
These dashboards are responsible for monitoring the performance of marketing initiatives, including advertising campaigns, effectiveness in content generation, new lead acquisition and the performance of different segments in each communication channel, among other relevant aspects.
An effective marketing dashboard should capture the most relevant insights from the current marketing strategy and guide a company's CMO in assessing the success of marketing activities over a specific period of time. In addition, the dashboard can be customised to the needs and objectives of the organisation, providing valuable information for strategic decision making.
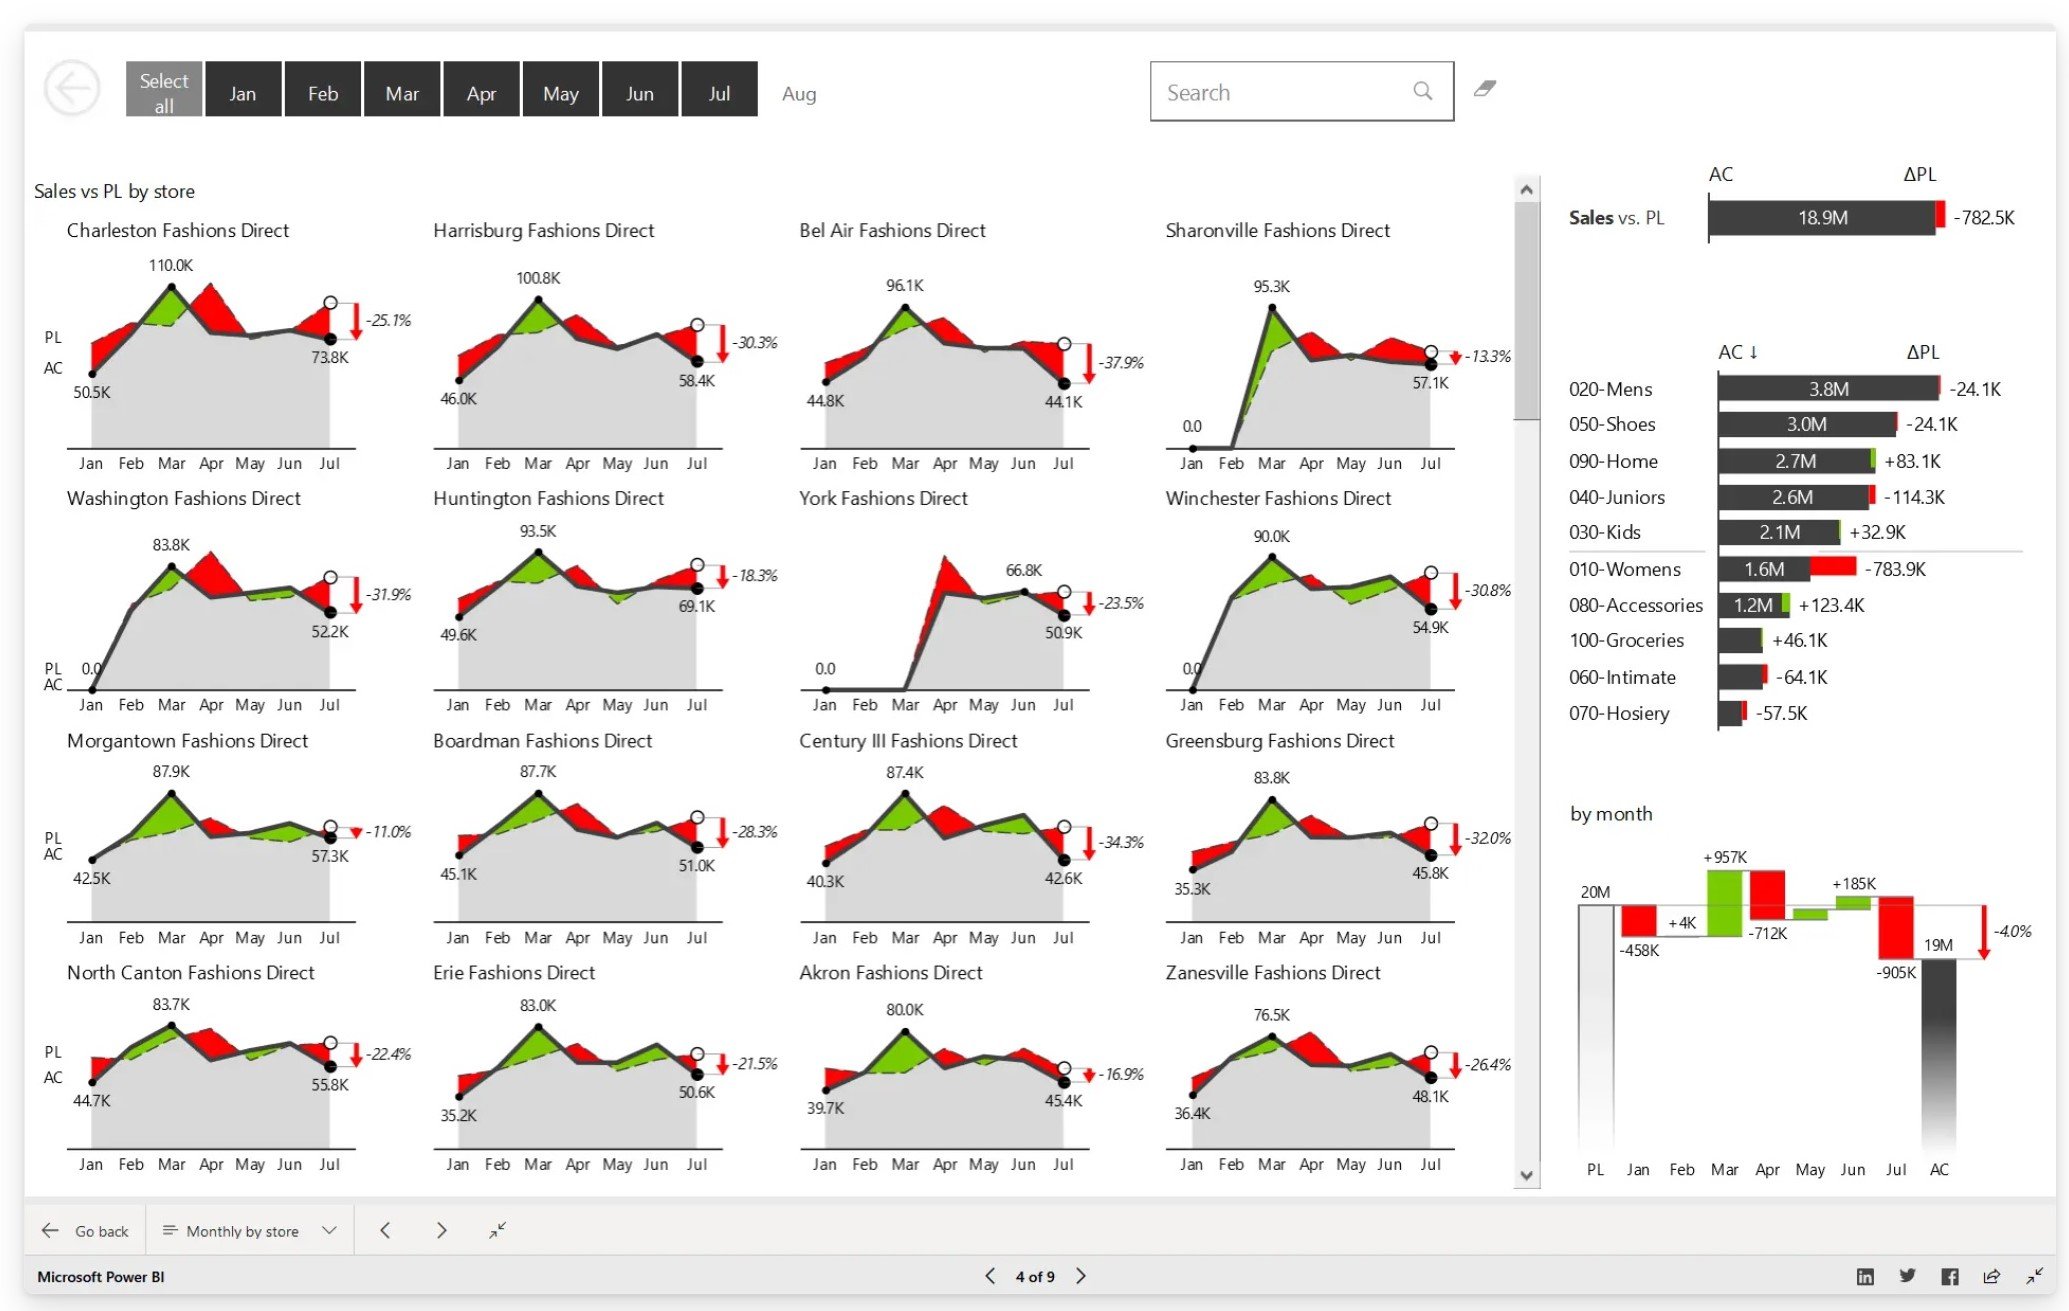
5. Sales Dashboard
Sales dashboards are an essential resource in any organisation. They are used to monitor sales and their evolution compared to previous periods, providing senior management with a clear view on the performance of the company's sales team.
In addition to tracking sales, these types of dashboards also provide valuable information on the performance of different product groups and different sales channels. Some dashboards even provide more detailed data, such as the revenue generated by specific customer segments, the volume of units sold in different geographic regions, the profitability of sales in each area or the return on investment of sales campaigns, promotions and offers during the year.
Of course, sales dashboards include key performance indicators (KPIs) that reflect the achievement of the company's most important sales targets. These KPIs are a vital tool for evaluating overall sales performance and making strategic decisions based on the results obtained.
6. Customer Segmentation Dashboard
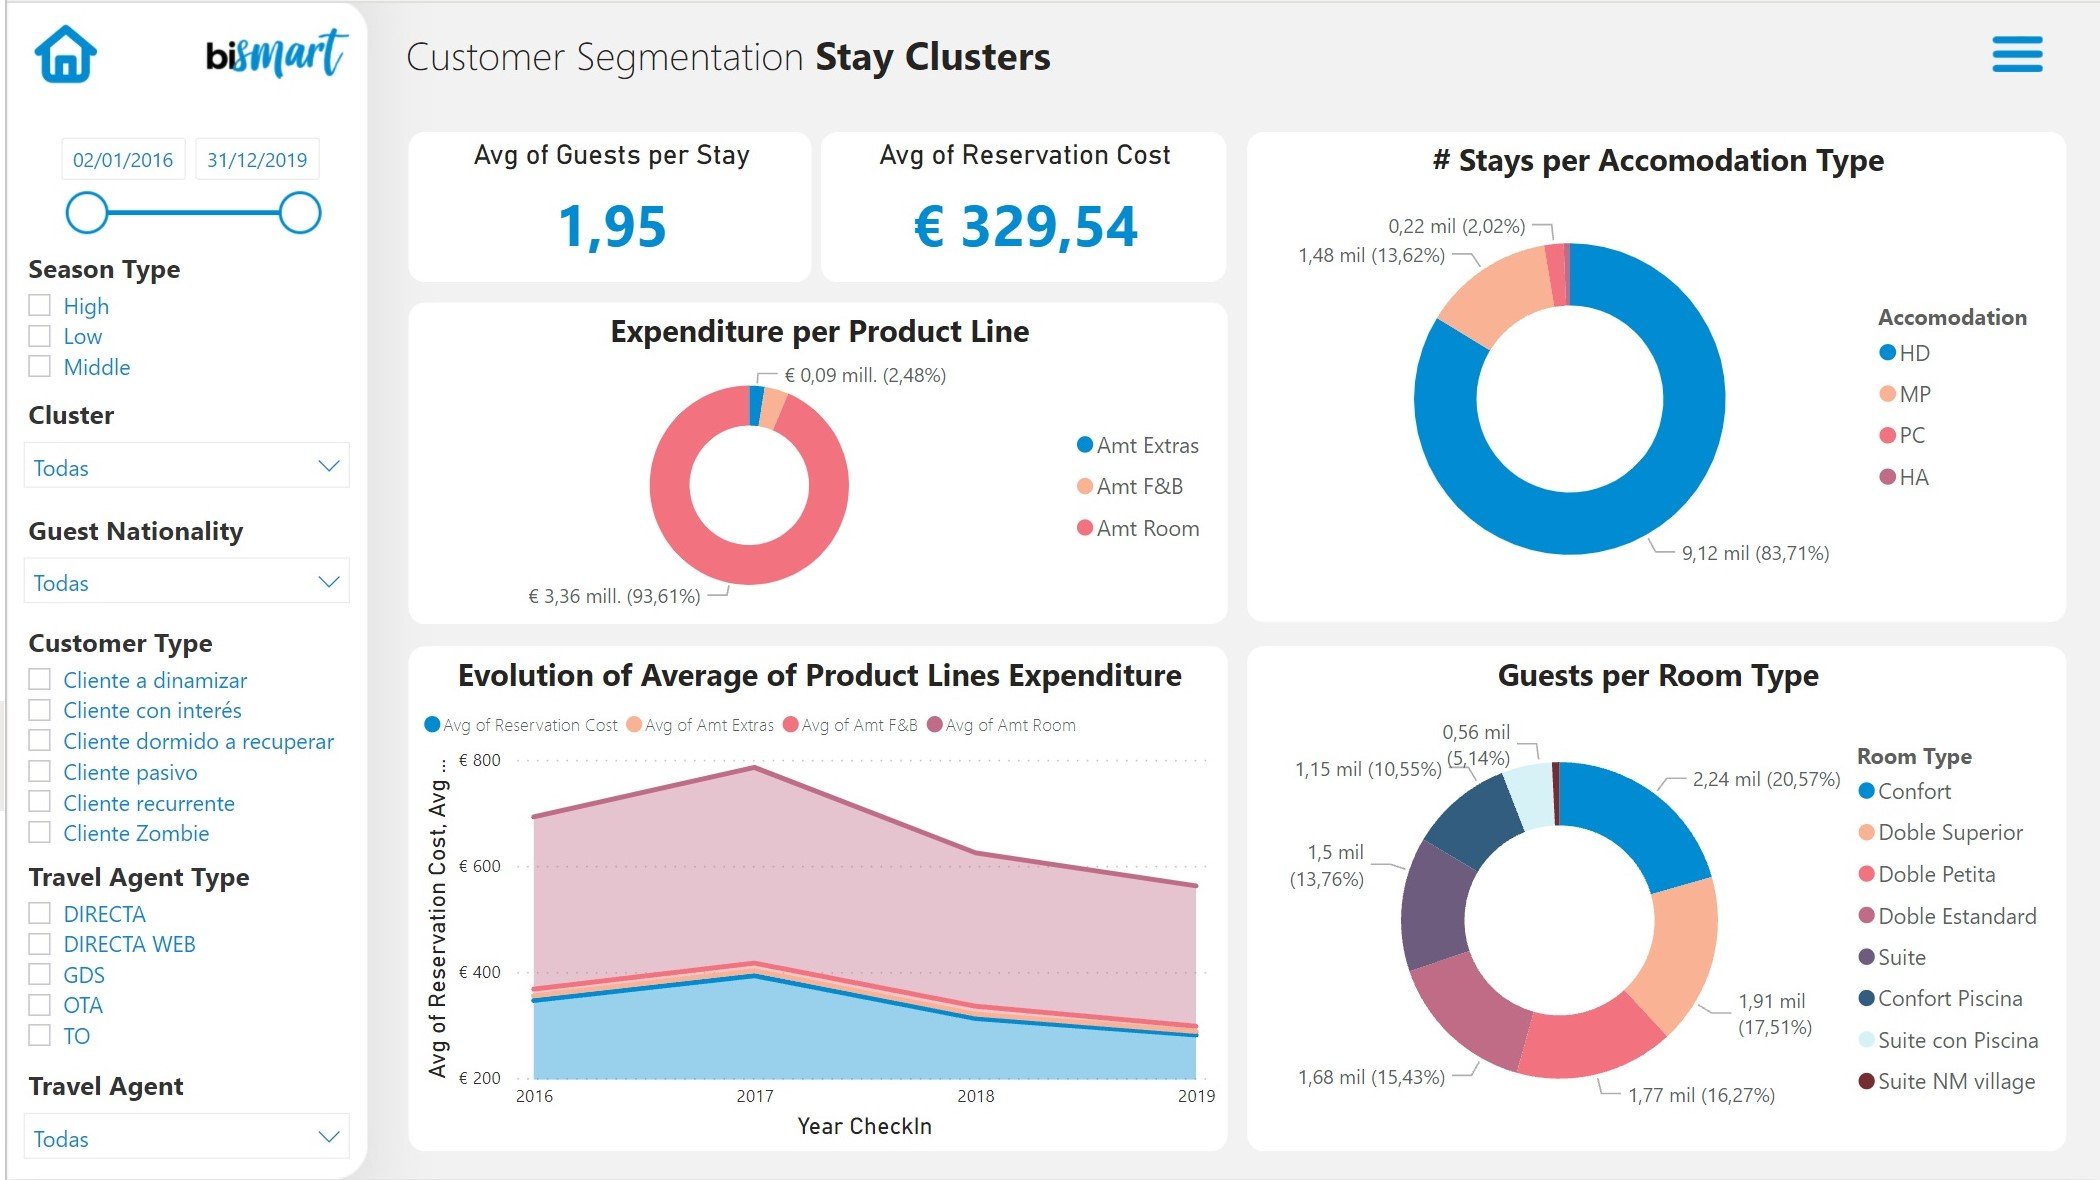
Dashboard by Bismart
Customer segmentation has become a key strategy in an increasingly customer-centric business world. Specialised segmentation dashboards give companies the ability to organise their market and classify customers according to established criteria, enabling them to deliver personalised solutions, products, service and experiences.
In addition, these dashboards are invaluable for gaining a deeper understanding of our customers, uncovering problem areas and discovering new business opportunities. By analysing the information gathered, we can gain a clearer picture of our customers' needs and preferences, enabling us to make more informed decisions and tailor our strategies to deliver added value more effectively.
7. Dashboard for Customer Portfolio Profitability
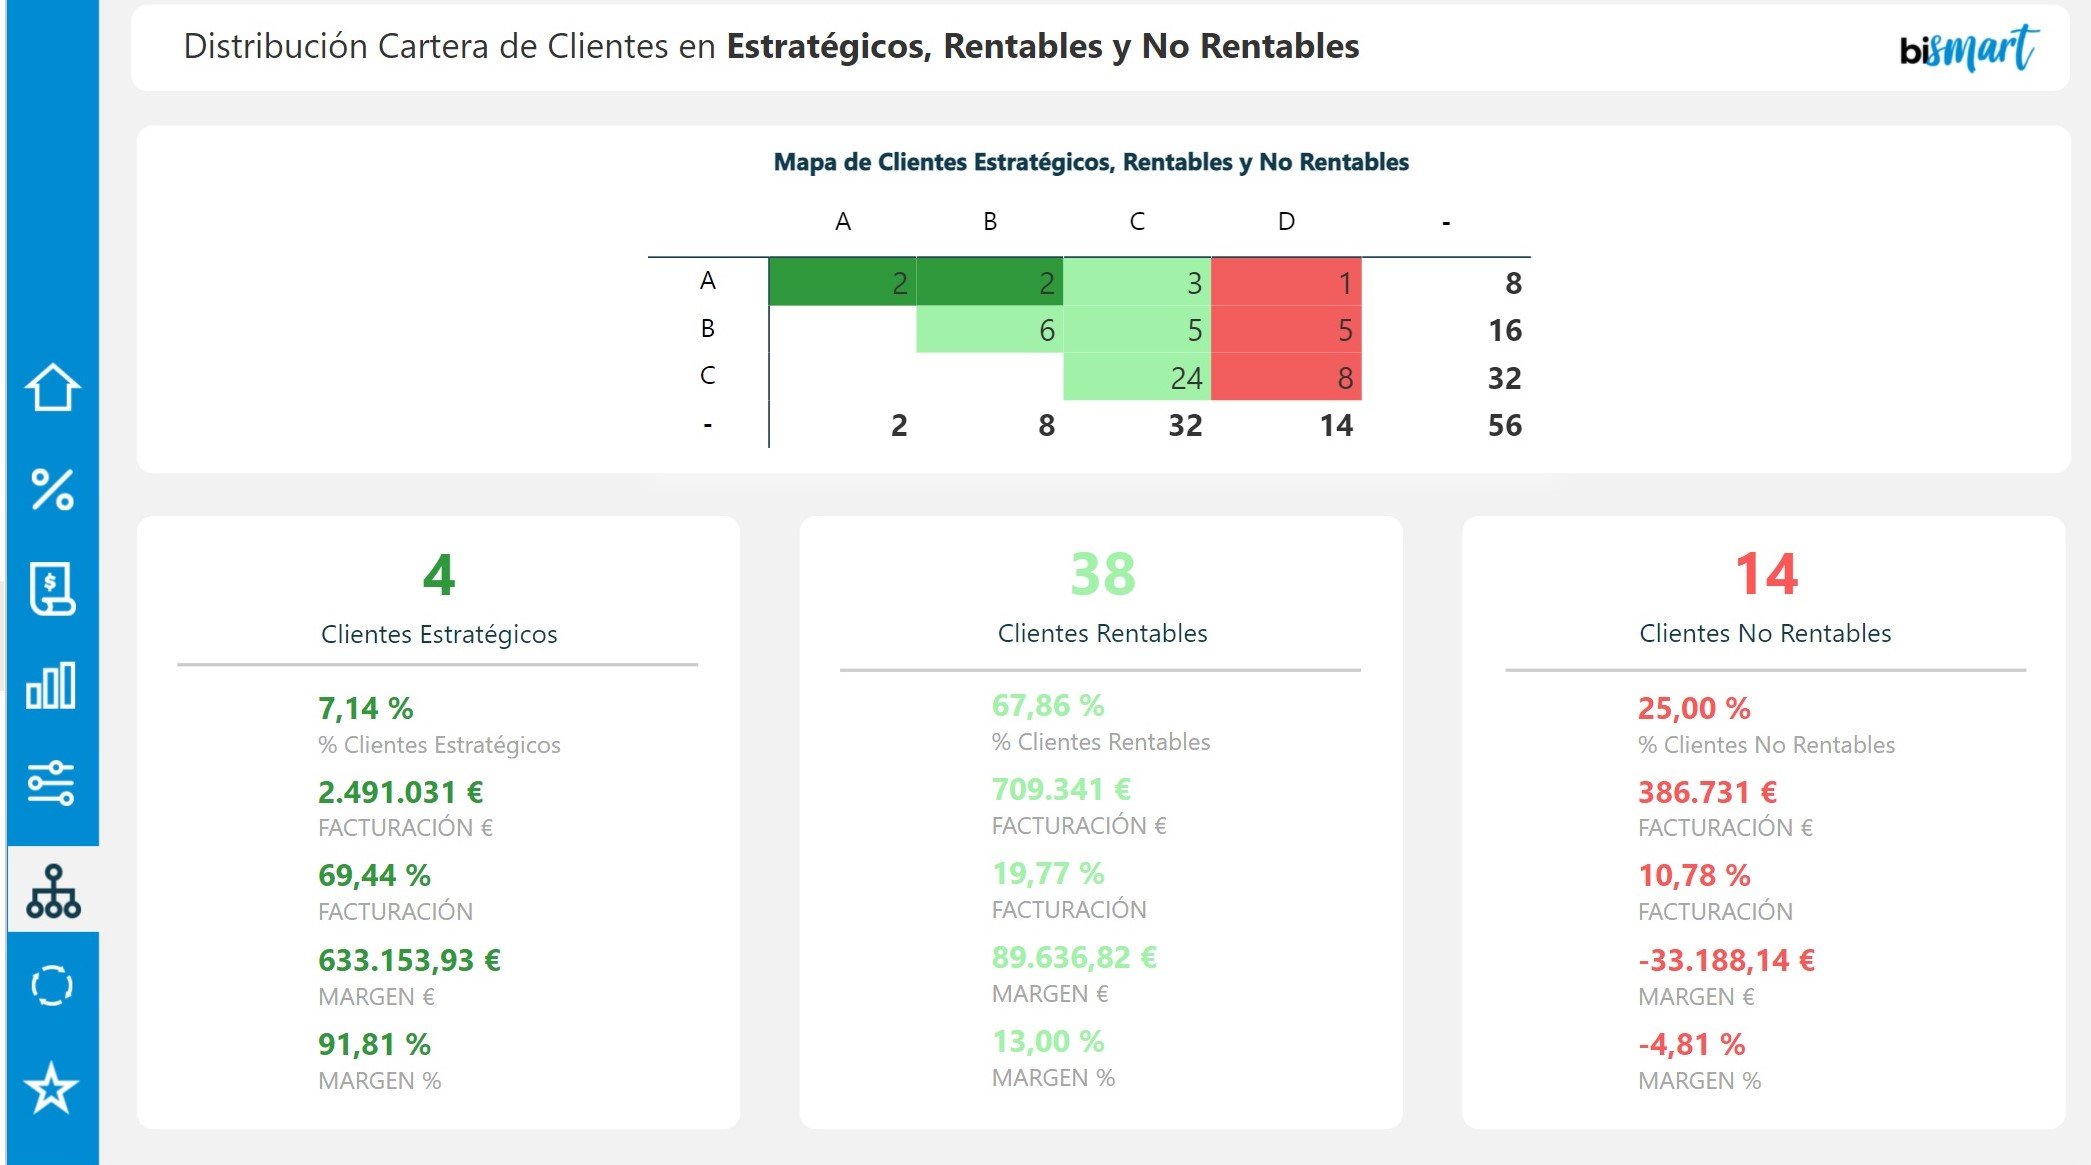
Dashboard by Bismart
A smart and productive strategy for segmenting our customer base is to consider the profitability of each customer.
In this regard, dashboards designed for profitability-based customer segmentation are emerging as an advanced, high-value technology solution that helps sales, marketing and commercial departments target the right customers.
These dashboards allow companies to align their business strategies with customer profitability, identify the target market, discover strategic customers and detect high-risk or unprofitable ones, among many other possibilities.
The ultimate goal of these tools is to support customer strategy teams, boosting their productivity and helping them make more informed strategic decisions. By using these dashboards, they will be able to optimise their efforts and achieve better results in driving their business forward.

8. Customer Journey Dashboard
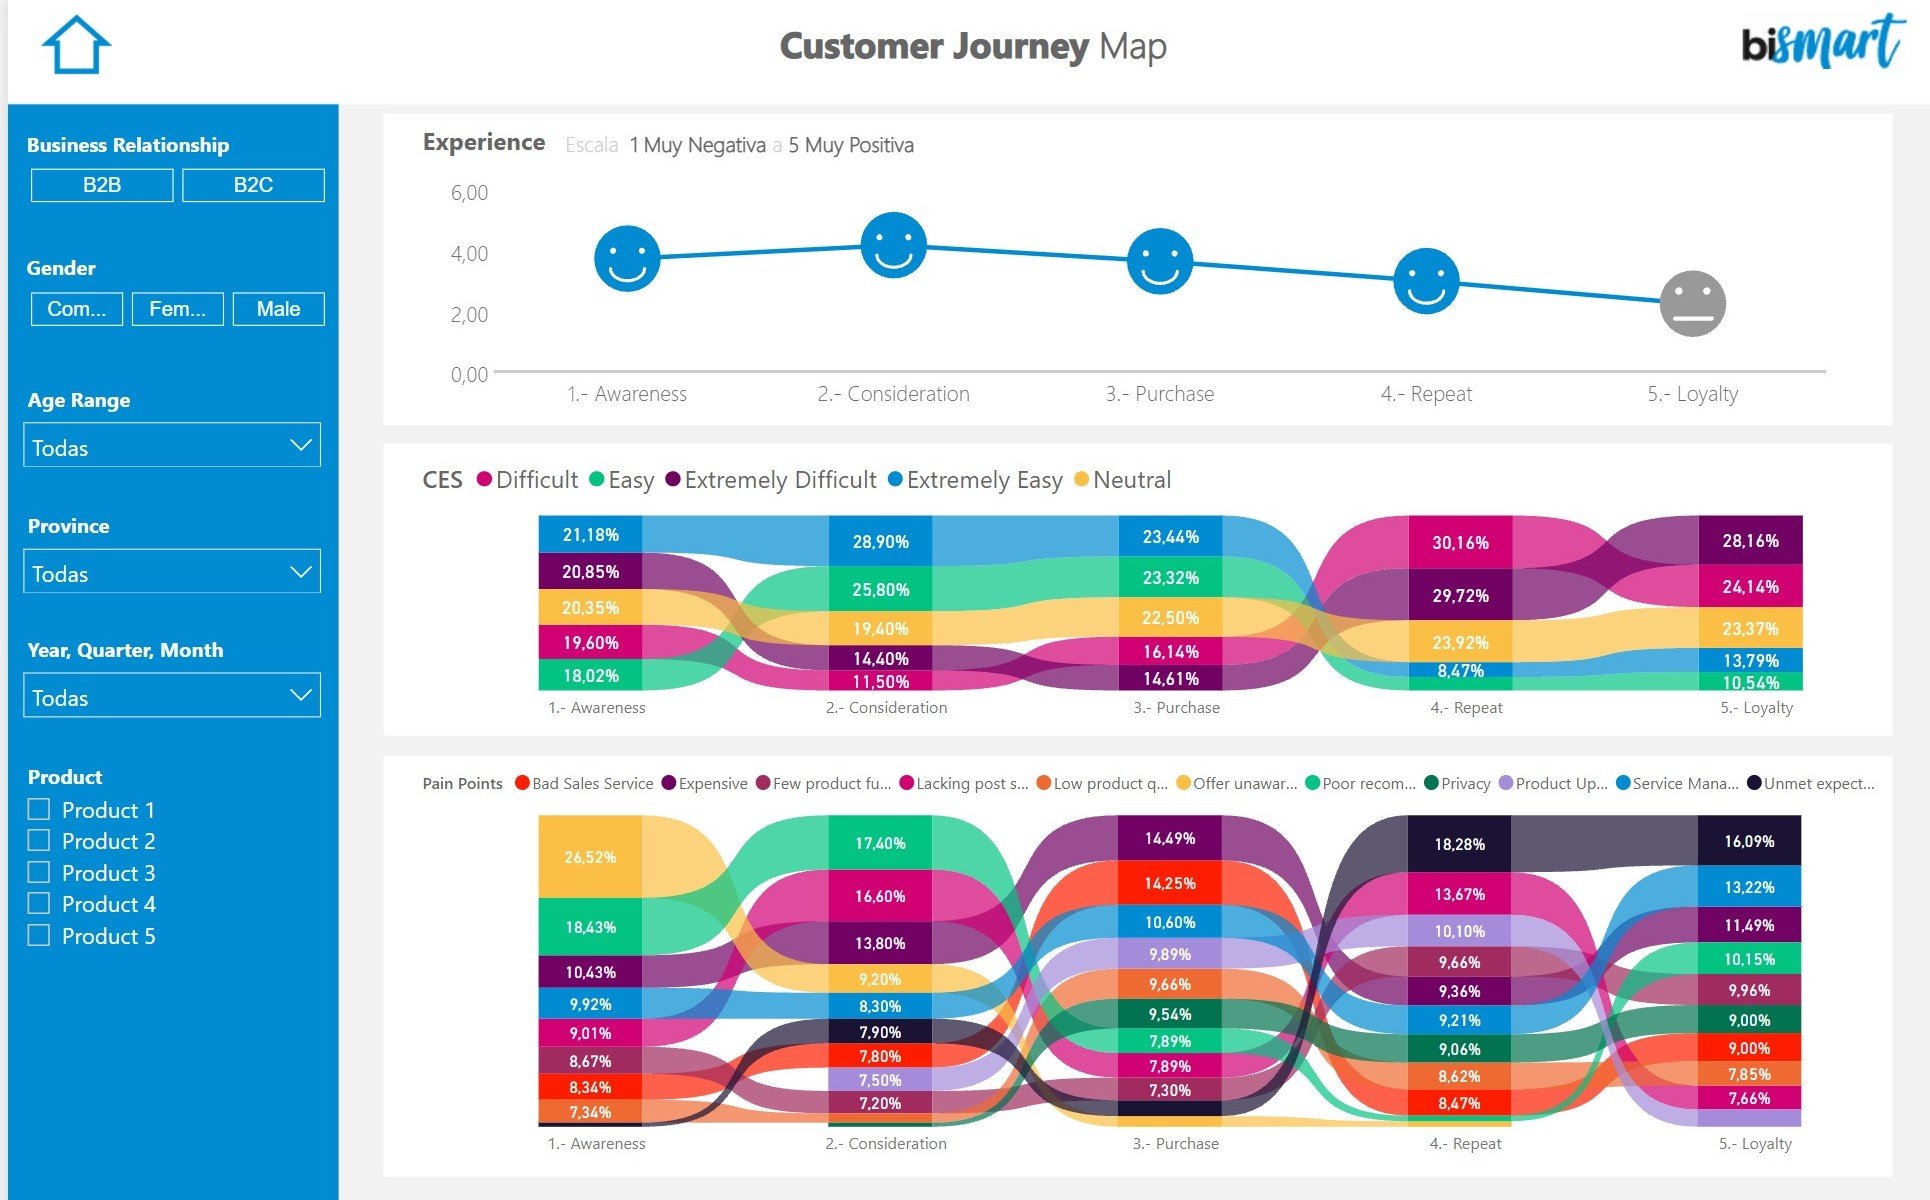
Dashboard by Bismart
In line with the latest trends in customer service strategies, more and more organisations are paying special attention to their customers' journey. Having a map that allows us to quantify our customers' customer journey has become the best way to improve their experience, develop personalised acquisition and retention strategies, and ultimately guide customers to the next stage of the buying process.
A customer journey dashboard should provide a graphical representation of the conversion funnel, map the different stages of the customer buying process and present the most relevant customer journey KPIs. In addition, it is important to consider that this type of dashboard can be adapted and customised according to the specific needs and characteristics of each organisation, allowing for more detailed analysis and more effective strategic decision-making.
Furthermore, to further enrich the customer journey management, additional information such as customer segmentation, interaction analysis at different touch points and the collection of direct customer feedback can be integrated. This will provide a more complete view and enable continuous optimisation of the customer journey, thereby improving customer satisfaction and business results.
9. Social Media Insights Dashboard
Today, social media has become a priority communication channel for companies. It is essential for organisations to have a solid strategic plan for content generation on these platforms.
Social Media Insights dashboards compile the most relevant metrics related to the social networks of each company. It is important to note that these dashboards can vary according to the strategic plan and social media presence of each business, adapting to the specific performance indicators of each case.
However, any dashboard designed to monitor social media performance should be an optimal environment to analyse the performance of content and communication campaigns in the digital sphere. Moreover, the study of audience behaviour and the brand-customer relationship on social networks can be decisive in crisis situations, and helps companies to better understand their customers and to understand the audience's opinion regarding their products and services.
In addition to traditional metrics, Social Media Insights dashboards can include additional information such as user engagement, market trends, the impact of advertising campaigns and brand perception in the digital environment.
10. Hotel Management Dashboard
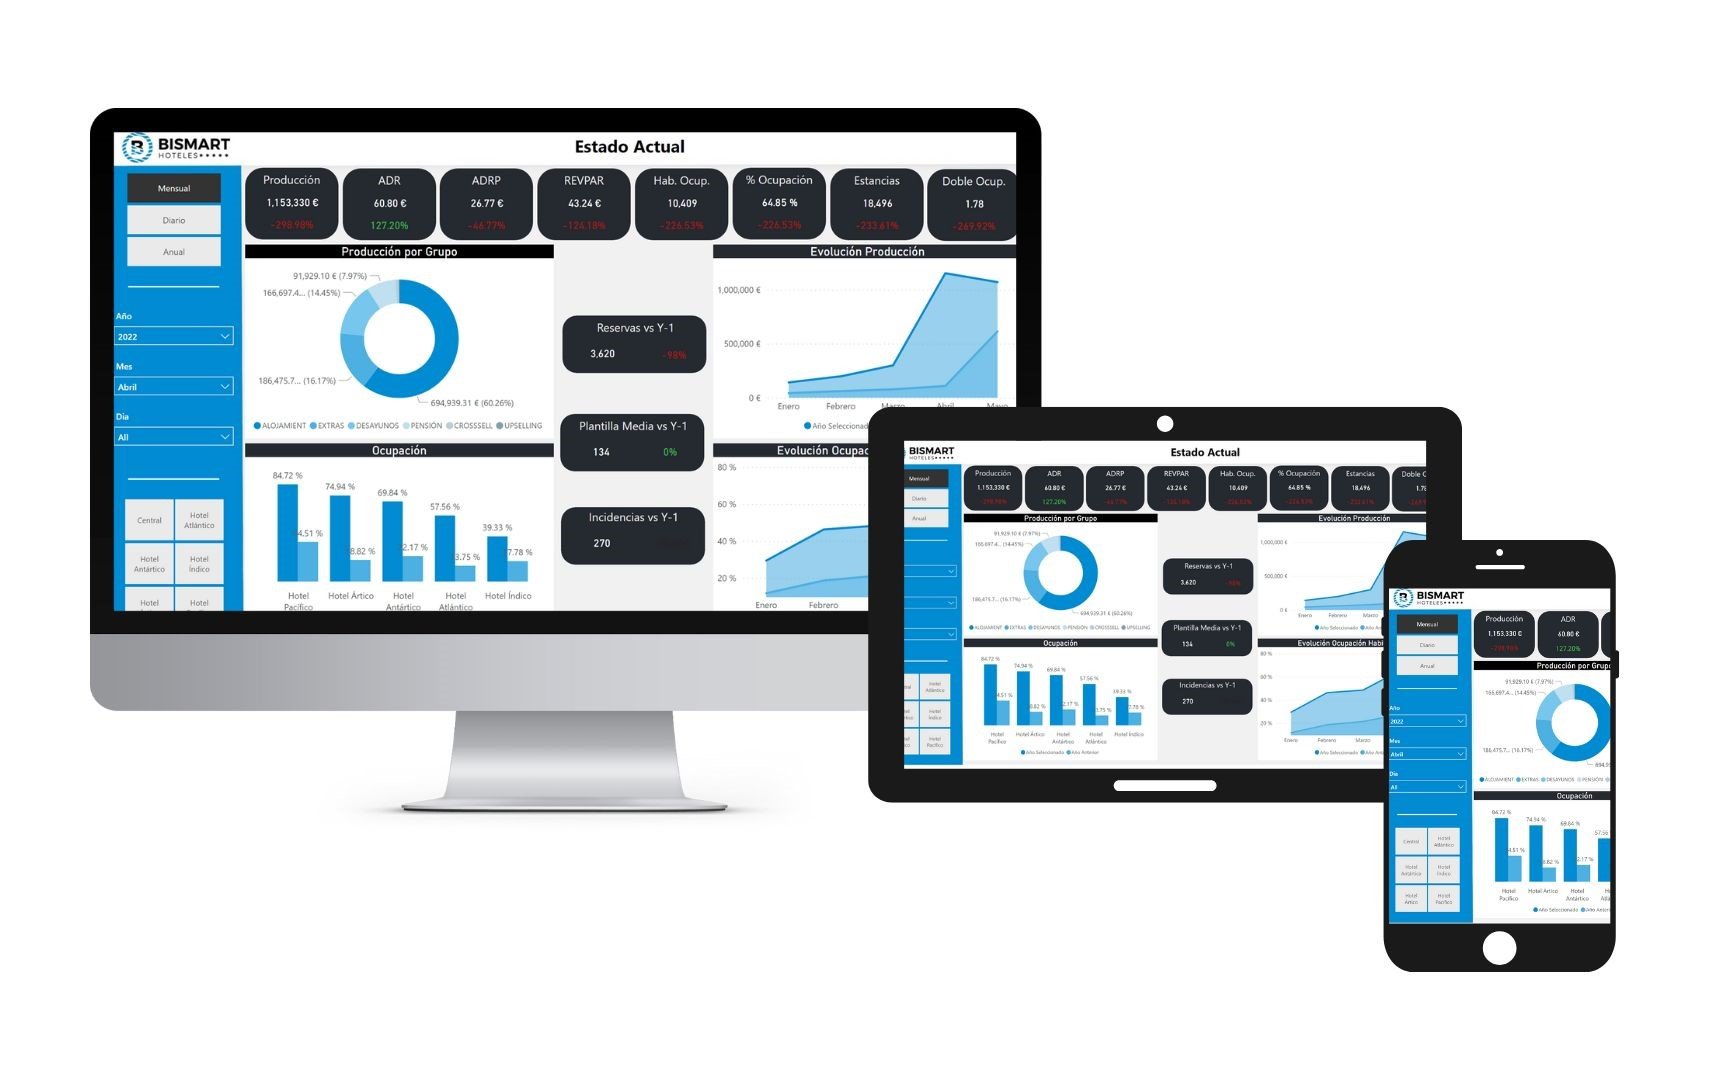 Dashboard by Bismart
In the hospitality industry, technology, data analytics, BI and artificial intelligence play an increasingly important role. These tools have become essential for hotels in their efforts to deliver world-class guest experiences and optimise their internal operations.
In this sense, more and more companies in the hotel sector are investing in technological solutions that allow them to better understand their activity and that of their competitors, as well as to gather business insights for better decision making and the implementation of loyalty and differentiation strategies, among others.
At Bismart, we have our own business intelligence solution for the hotel sector: Hotel Management Dashboards.
Hotel Management Dashboards is an analytical environment specifically designed for hotel chains that integrates all performance indicators and KPIs of one or multiple hotels in a single environment.
It's ultimate goal is to unify the information dispersed in different systems of the company, offering a comprehensive view of the business activity from all angles.
Hotel Management Dashboards consolidates all the relevant information that hotel managers may need, covering aspects such as revenue management, purchasing, sales, finance, reputation, staff, economic activity, web traffic, air traffic, among others. In addition, it integrates advanced predictive analytics capabilities, allowing managers to predict occupancy, optimise purchasing and make more informed decisions overall.
With Hotel Management Dashboards, hotel chain managers can make the most of available data and gain a competitive advantage by adapting their strategies in real time and maximising the profitability of their hotels.

11. Cross-selling and Up-selling Dashboard
A dashboard dedicated to cross-selling and up-selling is a specific solution designed for companies that sell products. This dashboard environment applies two key commercial strategies: cross-selling and up-selling, with the objective of increasing the revenue generated by existing customers. Using artificial intelligence capabilities, this solution identifies relational patterns between purchases, customers and products, enabling it to generate specific recommendations for effective cross-selling and up-selling. By analysing and understanding customer buying behaviours, this dashboard provides valuable information that helps companies to offer additional related products (cross-selling) or promote superior versions of existing products (up-selling), which in turn helps to increase sales and profitability of the company.
12. Human resources (HR) Dashboard
A dashboard dedicated to human resources is a tool designed to control and monitor the performance of employees, departments and business areas within a company. Its main objective is to study the profitability of each area, forecast results and identify productivity problems. This dashboard includes metrics that are directly related to the productivity, profitability and workload of different workers and departments. By providing clear and concise information on the performance of human resources, this scorecard enables leaders and managers to make informed decisions to optimise the efficiency and overall performance of the organisation.
Dashboards to improve management, security and productivity in Power BI
An increasing number of companies are developing a self-service BI strategy based on Power BI. This type of strategy requires significant technological support to enable organisations to self satisfy their business intelligence needs.
On this occasion, we present 3 dashboard environments designed to facilitate productivity, asset management and promote security within Power BI.
13. Power BI Viewer
Power BI Viewer is a dashboard platform that provides the ability to view all of a company's Power BI reports in a single, customisable space, all through a single Power BI Embedded licence. This solution enables companies to optimise their business intelligence self-service strategy and take full advantage of Power BI Pro, while significantly reducing costs. By providing a centralised and accessible environment, Power BI Viewer facilitates collaboration and data analysis across the organisation, improving decision making based on accurate and up-to-date information.

14. Power BI Analytics
Power BI Analytics is a dashboard platform designed specifically for Power BI that provides organisations with the ability to analyse all activity recorded in the Power BI service without restrictions on time, users or workspaces. With this tool, companies can perform analysis over any time period, leveraging an unlimited historical repository of data. In addition, Power BI Analytics guarantees the security and confidentiality of the information stored, as each organisation has its own exclusive data repository. This makes Power BI a comprehensive environment for data analysis, allowing companies to obtain valuable information and make informed decisions based on a global and detailed vision of their activity.

15. Power BI Data Catalog
Power BI Data Catalog is a tool that facilitates the self-documentation of Power BI datasets by supplementing them with functional and business descriptions. Its main goal is to promote the proper use of datasets and empower business users to create their own reports without technical assistance. By providing detailed information about the structure and context of datasets, Power BI Data Catalog promotes understanding and optimal use of available information. This enables business users to make informed decisions and develop customised analyses more efficiently, streamlining the process and reducing reliance on technical teams.

Looking for more?
Don't miss our complete e-book where you will find the 15 best Power BI dashboards of 2023 with a detailed explanation of the metrics and performance indicators they should include.


