Creating dashboards is one of the most common tasks in Power BI. In this article we explain how to create a dashboard in Power BI in 4 easy steps!
Creating a dashboard is one of the most common tasks when working with Power BI. However, people who are not used to working on the platform may encounter difficulties when designing a dashboard in Power BI. We explain how to create a dashboard in Power BI!
One of the great advantages of Power BI is that it allows users to create dashboards through data sets. Businesses use dashboards to track their business activity and make data-driven decisions.
In the corporate environment, creating dashboards is a regular task. That's why Power BI enables the creation of themes so that analysts and data scientists can apply the same design to multiple dashboards and don't have to build each dahsboard from scratch. Themes also enable dashboards creators to adapt the design of their dashboards to the company's corporate image.
- Ready to start turning data into powerful stories with Power BI? Download our e-book and create your first Power BI Dashboard in 5 easy steps!

- Learn all you need to know about dashboards in our Webinar: Dashboards - Clarifying Concepts
However, for a user who is not used to working with Power BI, creating a dashboard can be confusing. First of all, it is essential to be clear about what a dashboard is and what it is for.
It is also essential to understand that a dashboard and a report are not the same.
Once we are clear on what it is and the basic concepts surrounding it, we can move on to creating a dashboard in Power BI.
As a Microsoft Power BI partner, at Bismart we create many of our solutions with this powerful tool.
Why use Power BI to create a dashboard?
Power BI is a powerful and versatile tool for creating dashboards. With its ability to visualise data in a clear and understandable way, Power BI enables users to make data-driven decisions more effectively.
Creating a dashboard in Power BI can be confusing for those unfamiliar with the platform, but by following a few basic steps, it is possible to create a dashboard easily. First, it is important to select the data set you want to display on the dashboard and make sure it meets your business objectives. Then, you need to connect the necessary data sources, either from a single source or from multiple sources in different formats.
Power BI makes it easy to integrate data and create a data model to unify it. After establishing the relationships between tables, data visualisations can be created using the various charts and visuals available in Power BI. It is important to consider the design and format of the dashboard so that it is easy to understand and tells an effective story. By following these steps, any user can create a dashboard in Power BI and take full advantage of this powerful data analysis tool.
Also, since the launch of Microsoft Fabric, important new features have been added to Power BI. The most notable is Power BI Desktop Developer Mode, a new Power BI extension for developers that facilitates collaborative work and version control.
- Don't miss the 15 Best Power BI Dashboards of 2023
What is a dashboard for in business intelligence?
A dashboard is essential in a Business Intelligence strategy because it allows you to visualise and analyse data in a clear and understandable way. Power BI, a powerful and versatile tool, facilitates the creation of dashboards by allowing users to make data-driven decisions more effectively. With Power BI, it is possible to select the data set to be displayed on the dashboard and connect the necessary data sources, either from a single source or from multiple sources in different formats.
In addition, Power BI offers the possibility to establish relationships between data tables and create visualisations using different charts and visuals. The design and format of the dashboard are also important aspects to consider to ensure that it is easy to understand and tells an effective story.
In summary, a dashboard in Power BI is essential to a business intelligence strategy, as it allows you to transform data into stories and make data-driven decisions more efficiently.
How to create a dashboard in Power BI?
1. What data do you want to display?
The first step to create a dashboard is to select data set we want to visually represent. Dashboards are made to visualise data and make it understandable. So, before starting to create our dashboard, we must take our time to think and decide exactly what we want to show and why.
It is vital that our dashboard meets our business objectives and fits in with our business' logic.
2. Connection to data sources
It is very common for companies to need to include data sets that are stored in different data sources in the same dashboard. To keep track of our business activity we need to include data pertaining to different areas of the business. This is precisely why data integration and system integration are so important, because data fragmentation into multiple sources and formats can make the process extremely complicated.
If we have our data integrated in a single source and in the same format, we simply connect that source to Power BI in "Obtain data". On the other hand, if we need data from several sources we must select all the different data sources and then create a data model so that the data is in the same format and can be used.
If we want to explore the properties of our data, in "Fields" we will find a list of all the fields in our database and in "Properties" we can see all the settings we can apply to our data.
Once our data is in the format we want and is compatible we should have something like this:
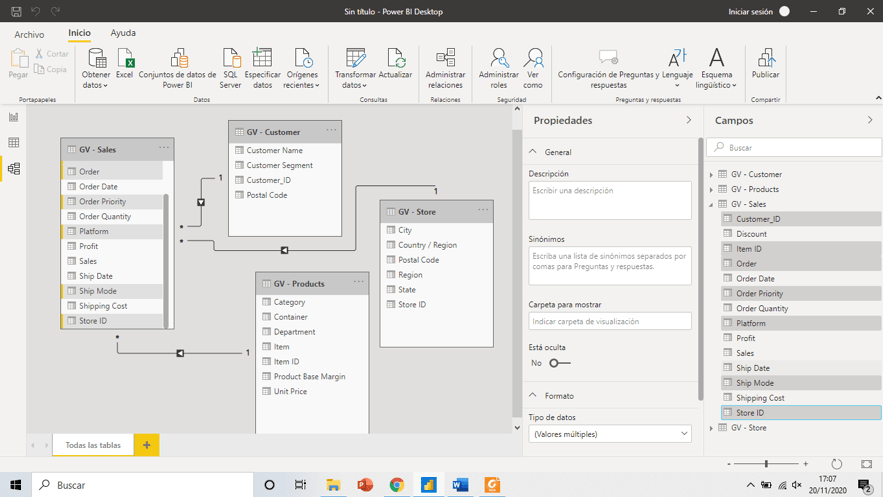
Source: Power BI
3. Set relationships between tables
As we can see in the image below, Power BI distributes data in tables and connects them automatically through relationships when it detects fields with the same name. However, it is very important to review the relationships created by Power BI and modify them in case they are incorrect or if we want to establish different relationship between the data.
We can modify relationships in: "Model" > "Relationships" > "Manage Relationships".
4. Data visualisation
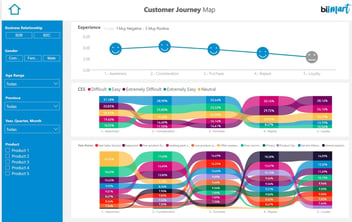
As we have already mentioned, dashboards are useful to represent data in a visual form, transforming it into something easy to interpret, understandable for any type of person and which leads to conclusions and decision-making.
Luckily, Power BI is one of the best data visualisation tools on the market and creating visuals with Power BI is quite easy. Simply go to "Report" where you will find the different charts and visuals that you can apply. Next, we must select the fields that we want to represent through the chart and indicate the calculation that we want to perform on each value.
Once created, we can change the format of the visual in "Format" as well as add extra information in "Analytics".
5. Dashboard's design
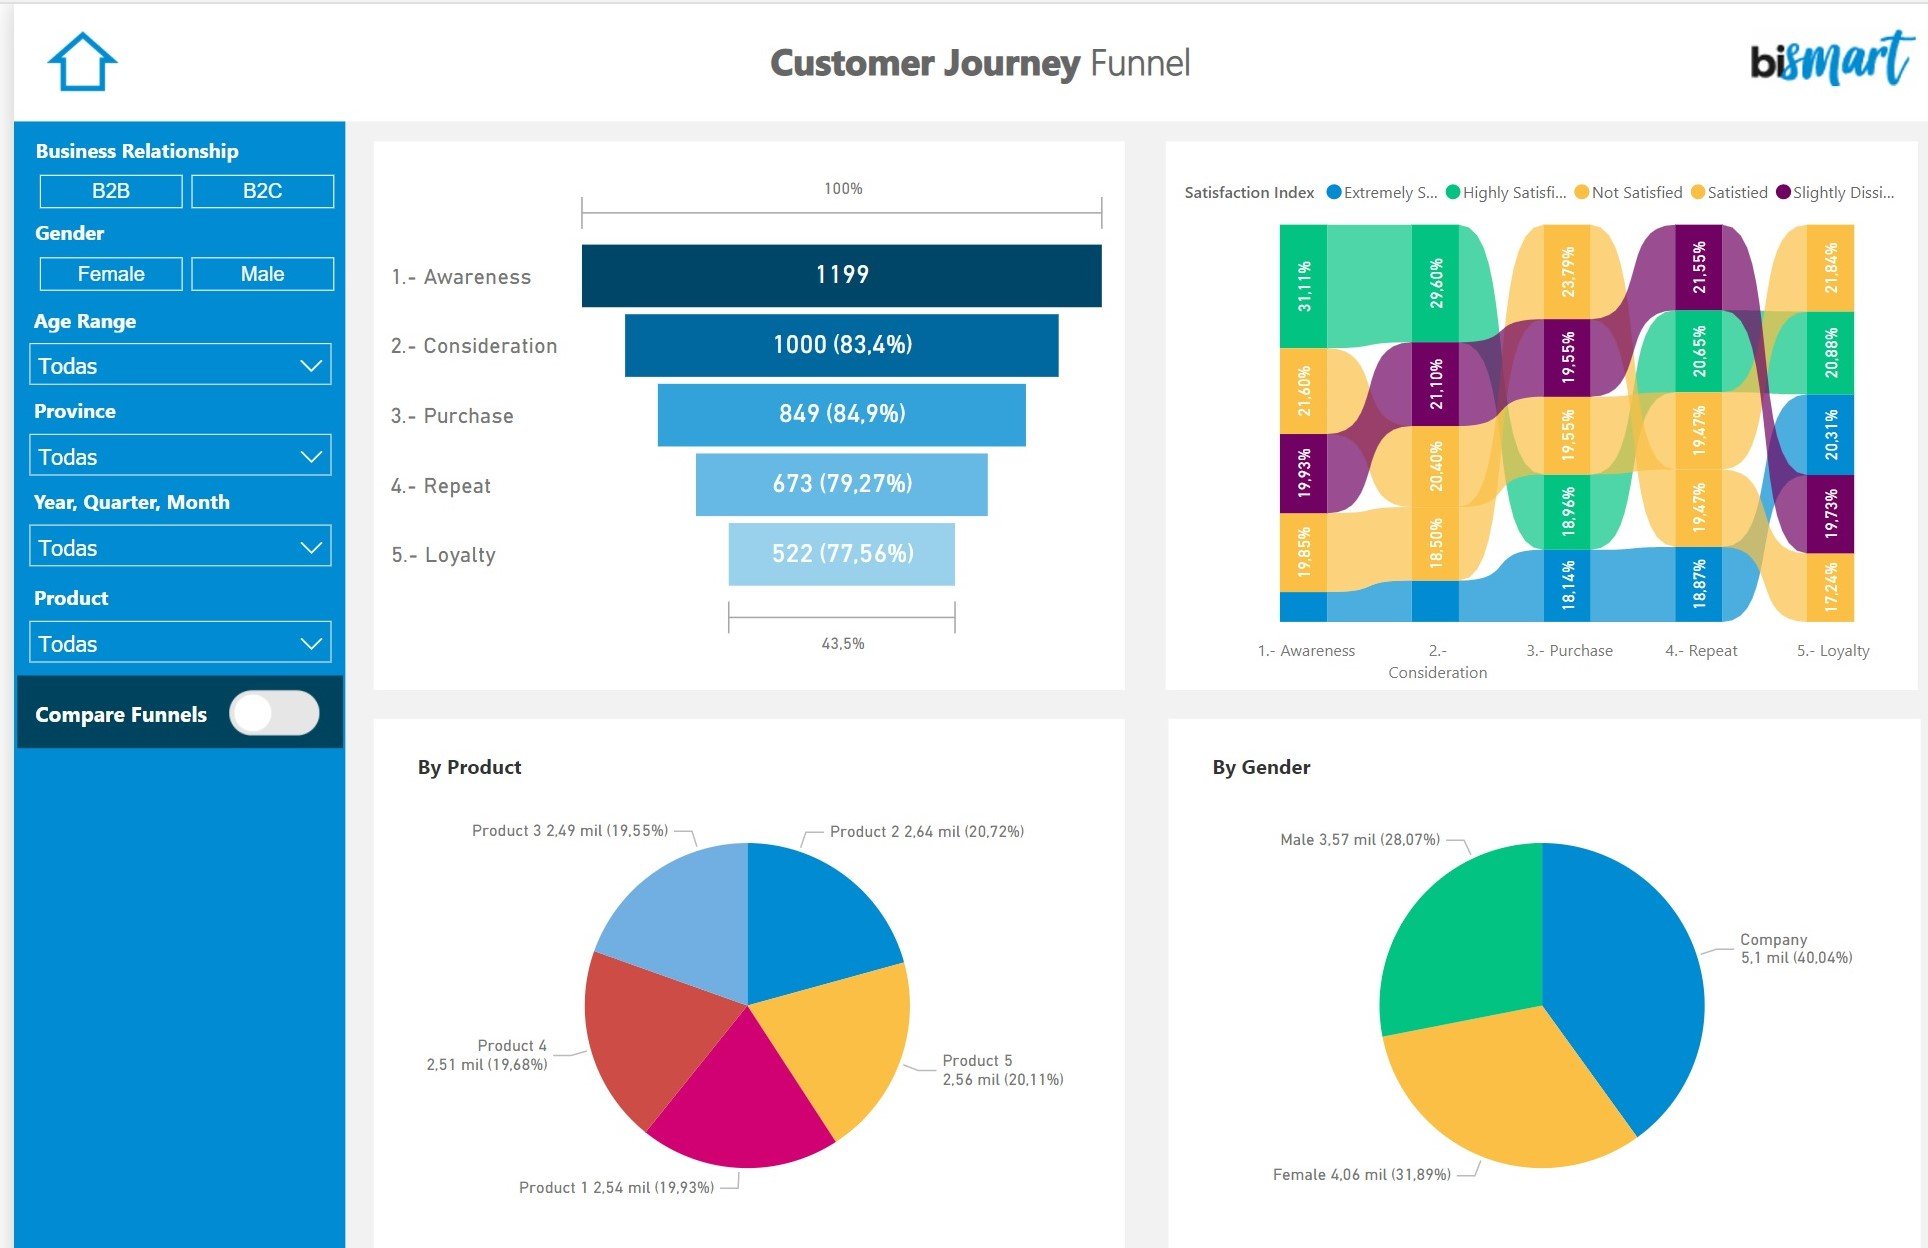
Beyond choosing visuals, it is also important to pay attention to the design and format of our dashboard. The way we lay out information, as well as the use of colours, sizes and text fonts can make all the difference in making our dashboard understandable, tell the story we want it to tell and be effective for the purpose for which it was designed in the first place.
A useful dashboard always indlcudes storytelling. The way we organise data, the design, the colours and the text are key elements in the construction of the storytelling and the adaptation of the dashboard to the corporate image (our own, or that of a client if we are creating a dashboard for a third party).
Conclusion
These are the 5 basic steps for creating a dashboard in Power BI. Of course, there are many advanced options such as applying segments, measures, filters and tooltips, for example. Beyond the technical functions, what is really important when creating dashboards is to make sure that our dashboard is useful for the business and meets our business needs.
Before you go...
Don't miss our free e-book where you will learn how to create a Power BI Dashboard in 5 steps!