Your Power BI Dashboard in 15 Minutes
Chances are you’ve come across a message like this before: “Build your Power BI dashboard in just 15...
Chances are you’ve come across a message like this before: “Build your Power BI dashboard in just 15...

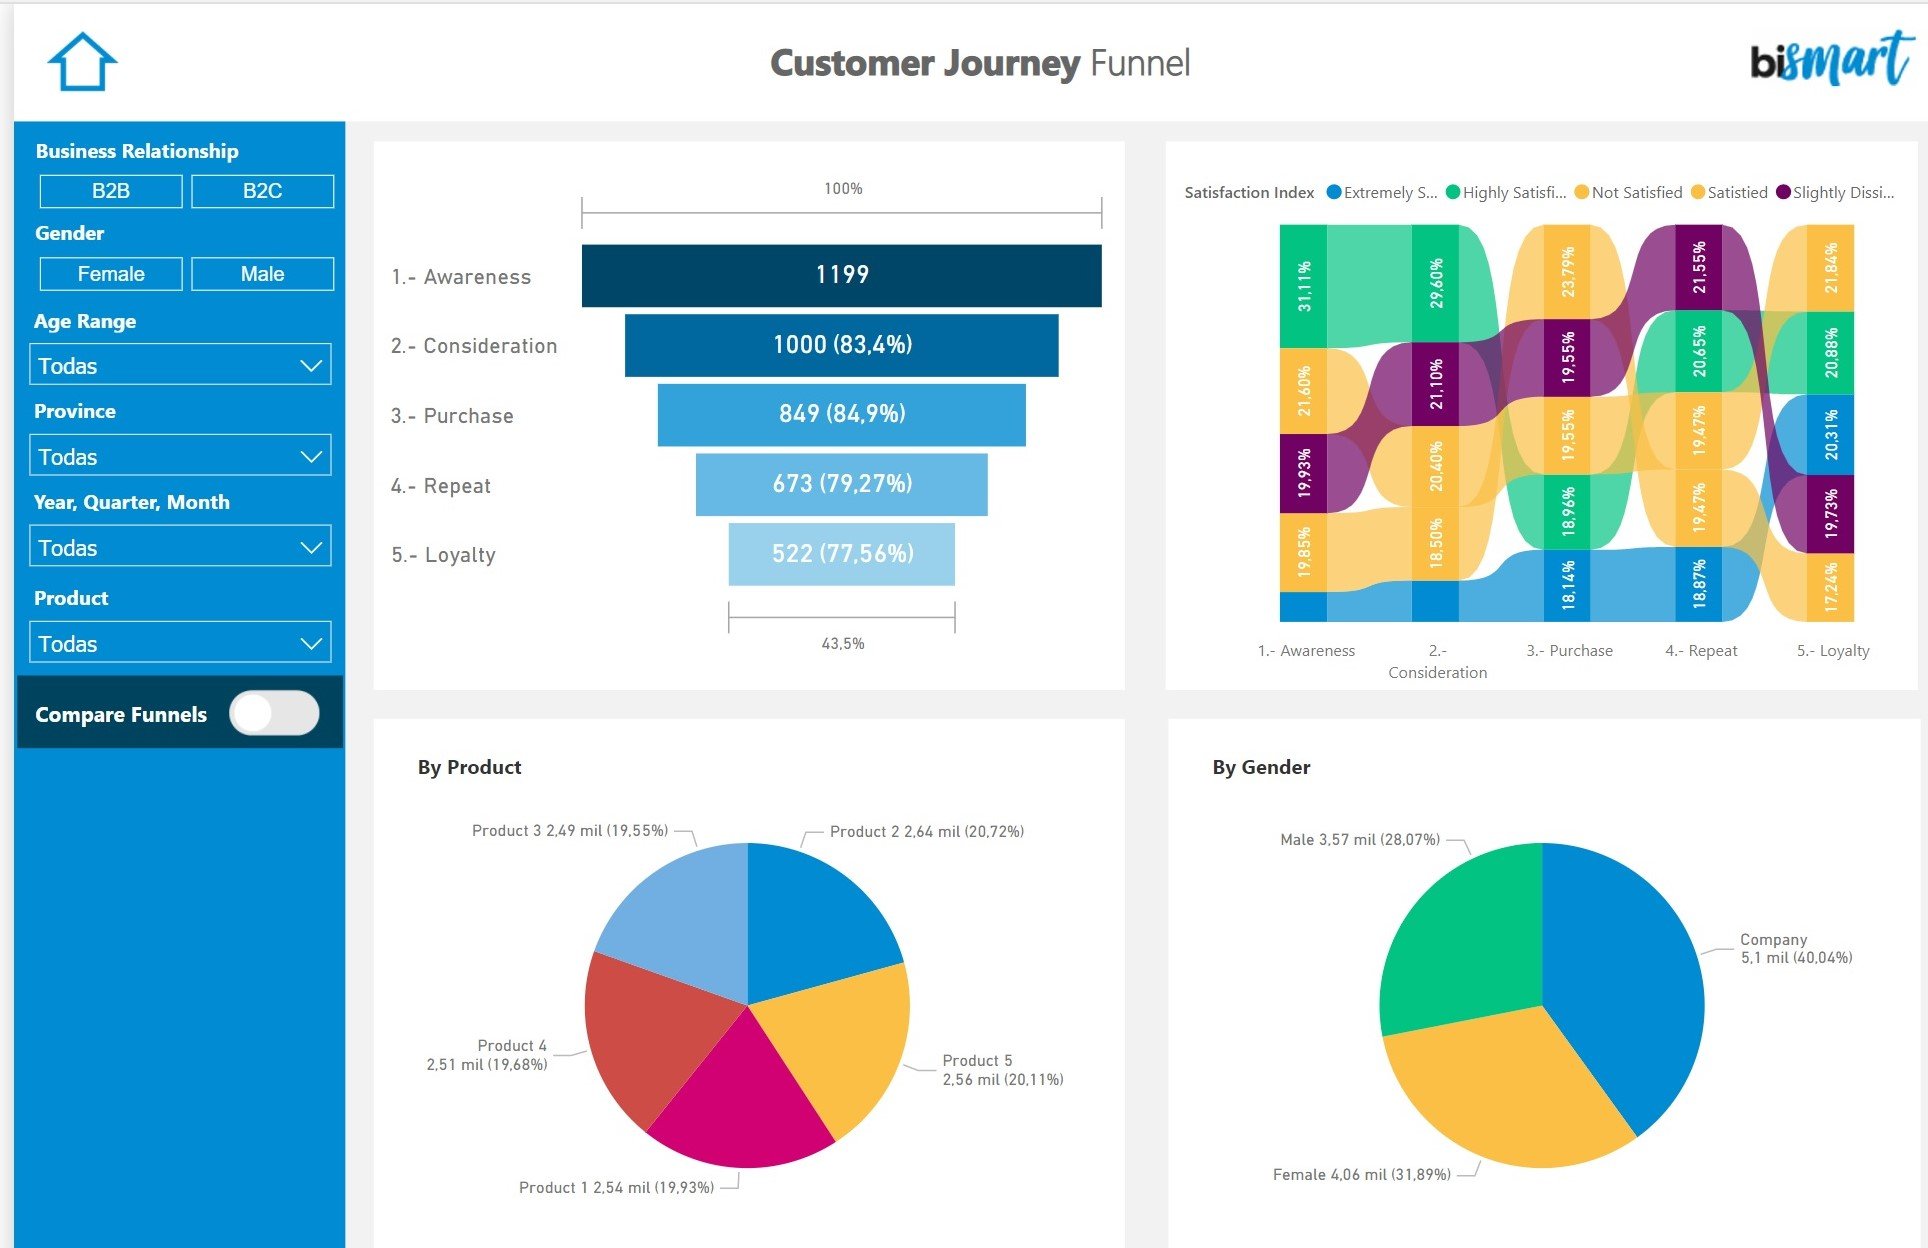
In the age of data, business dashboards should be designed using data storytellingtechniques . Data...
Visualisation is one of the most important aspects of reporting. Visuals play a major role in the de...
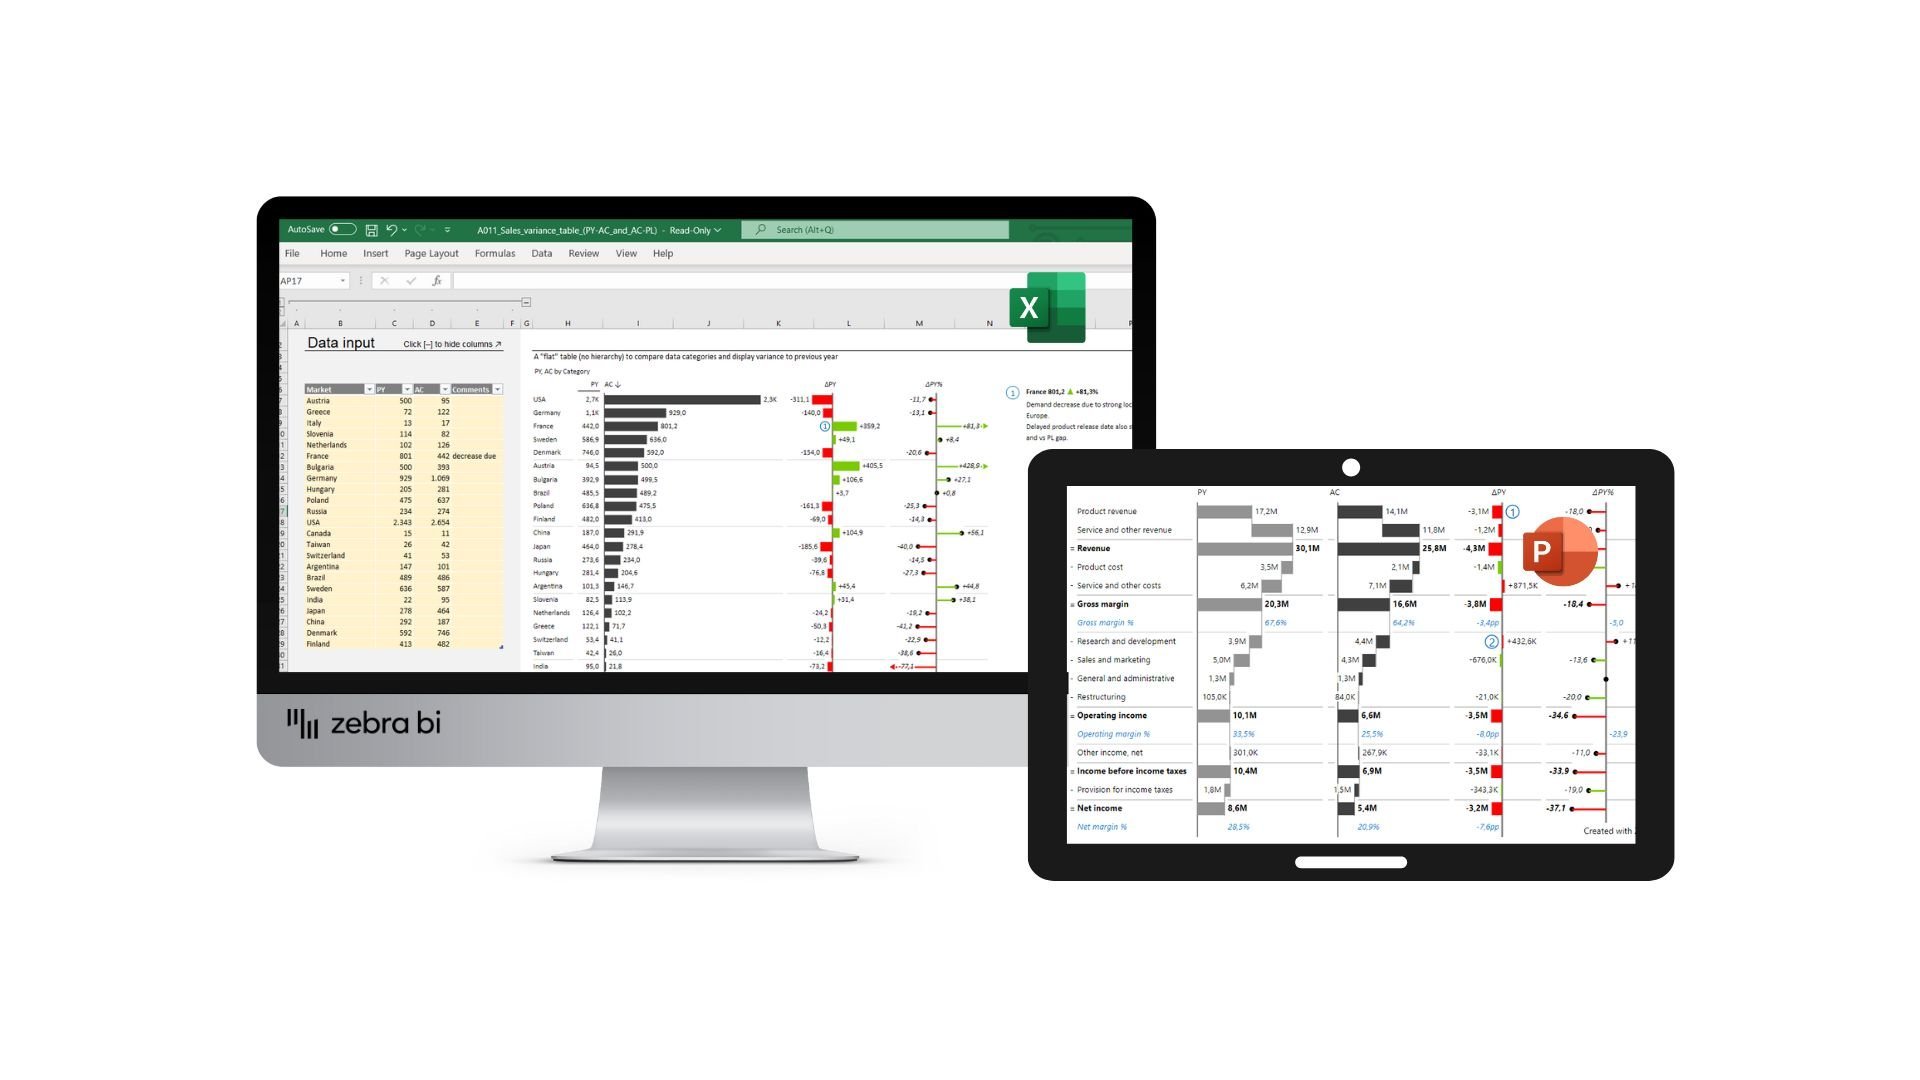
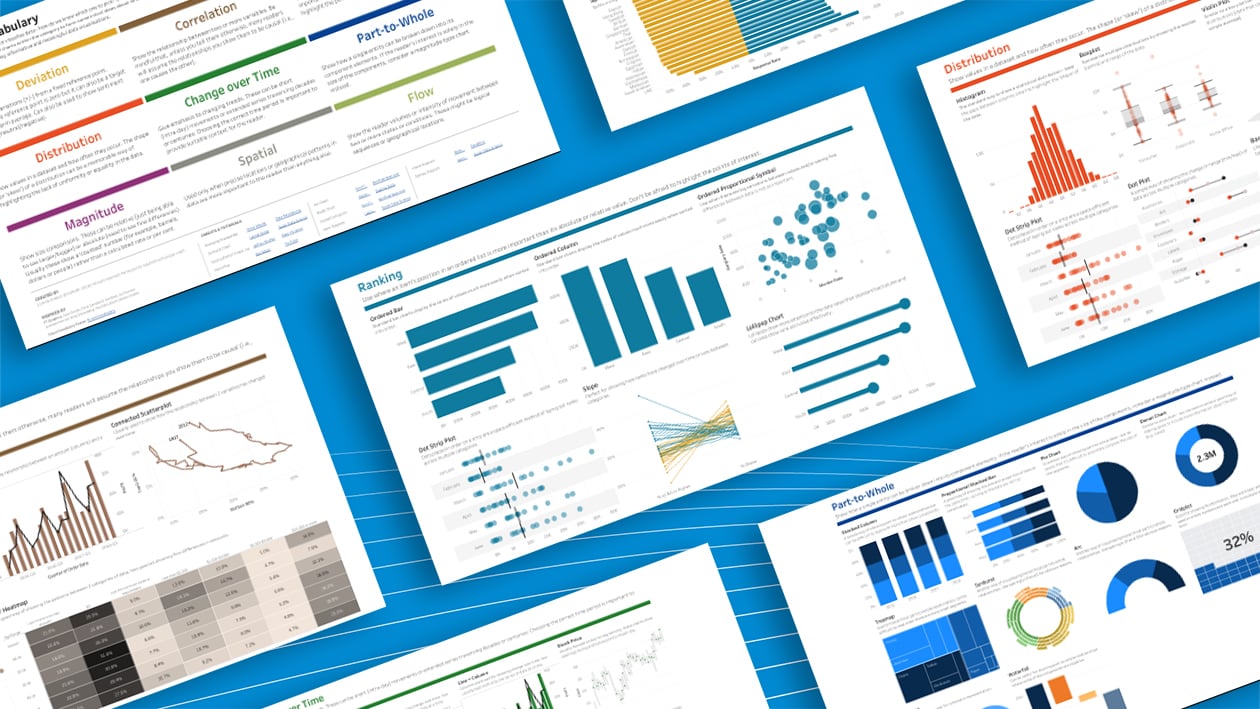
Last Tuesday we celebrated the official launch of Zebra BI Office, which provides Zebra BI visuals f...
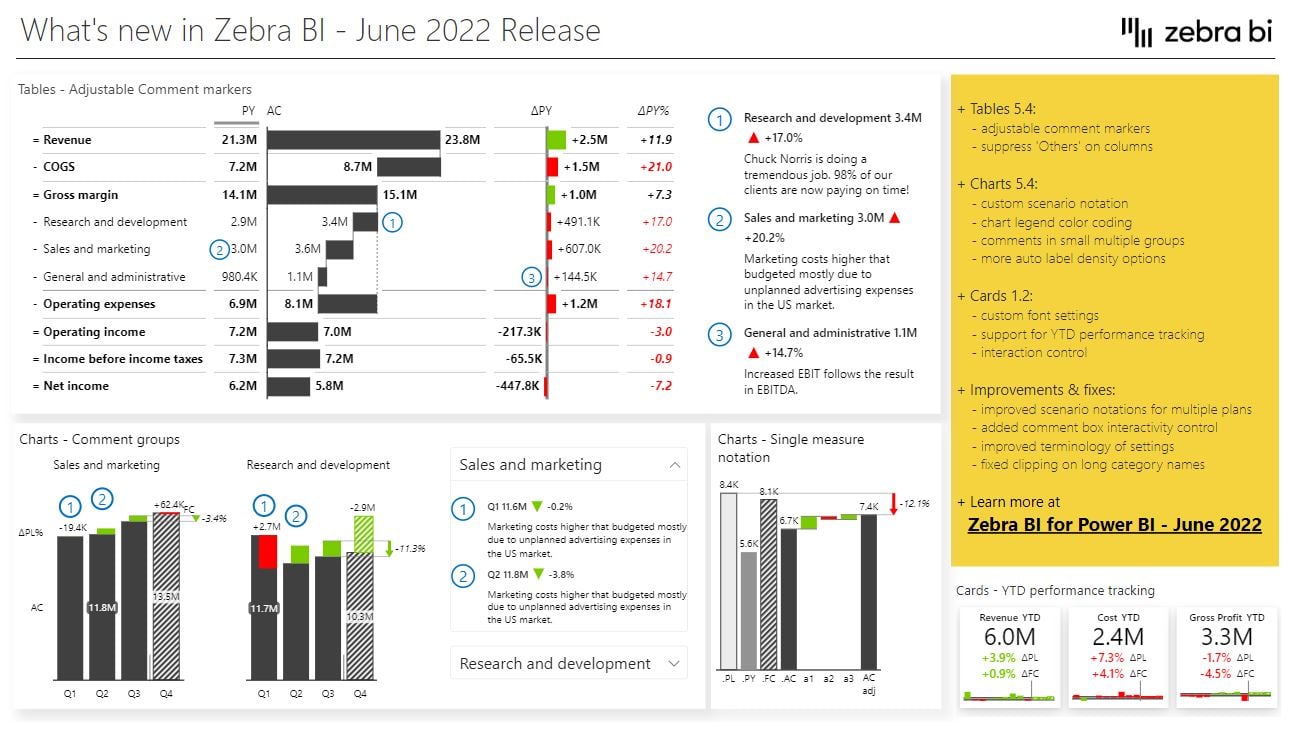
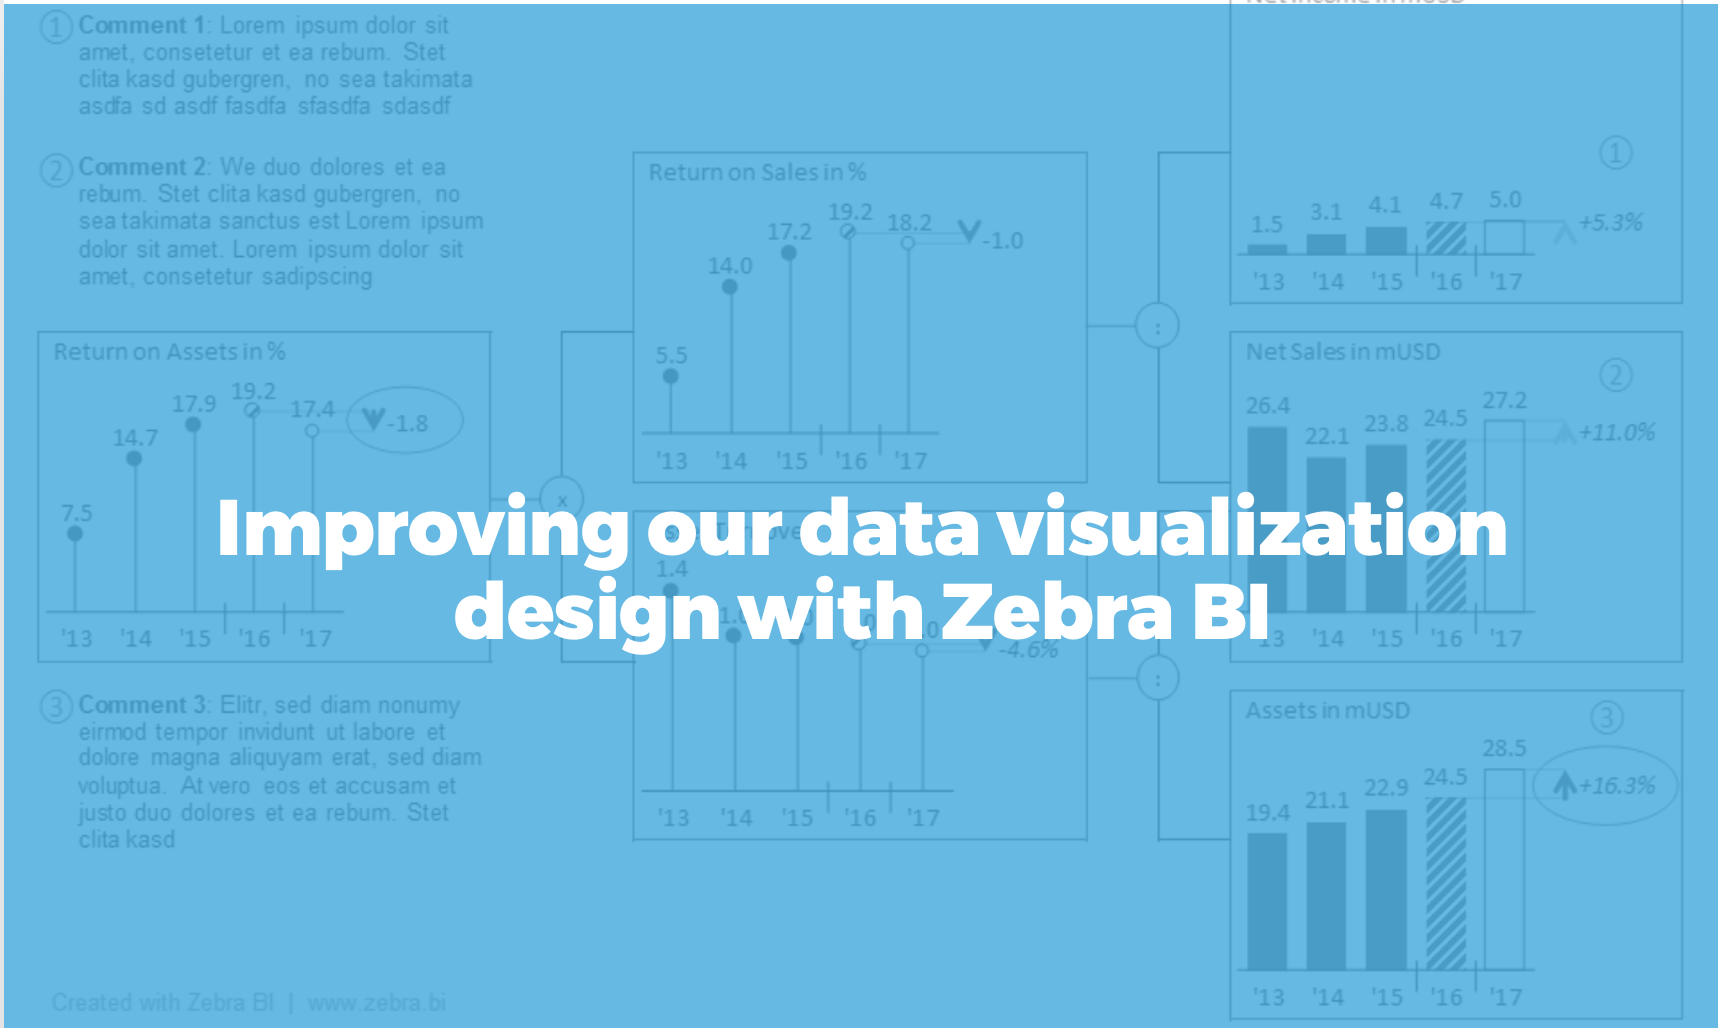
Zebra BI, a company that provides visuals for Power BI, has just announced an update that includes n...