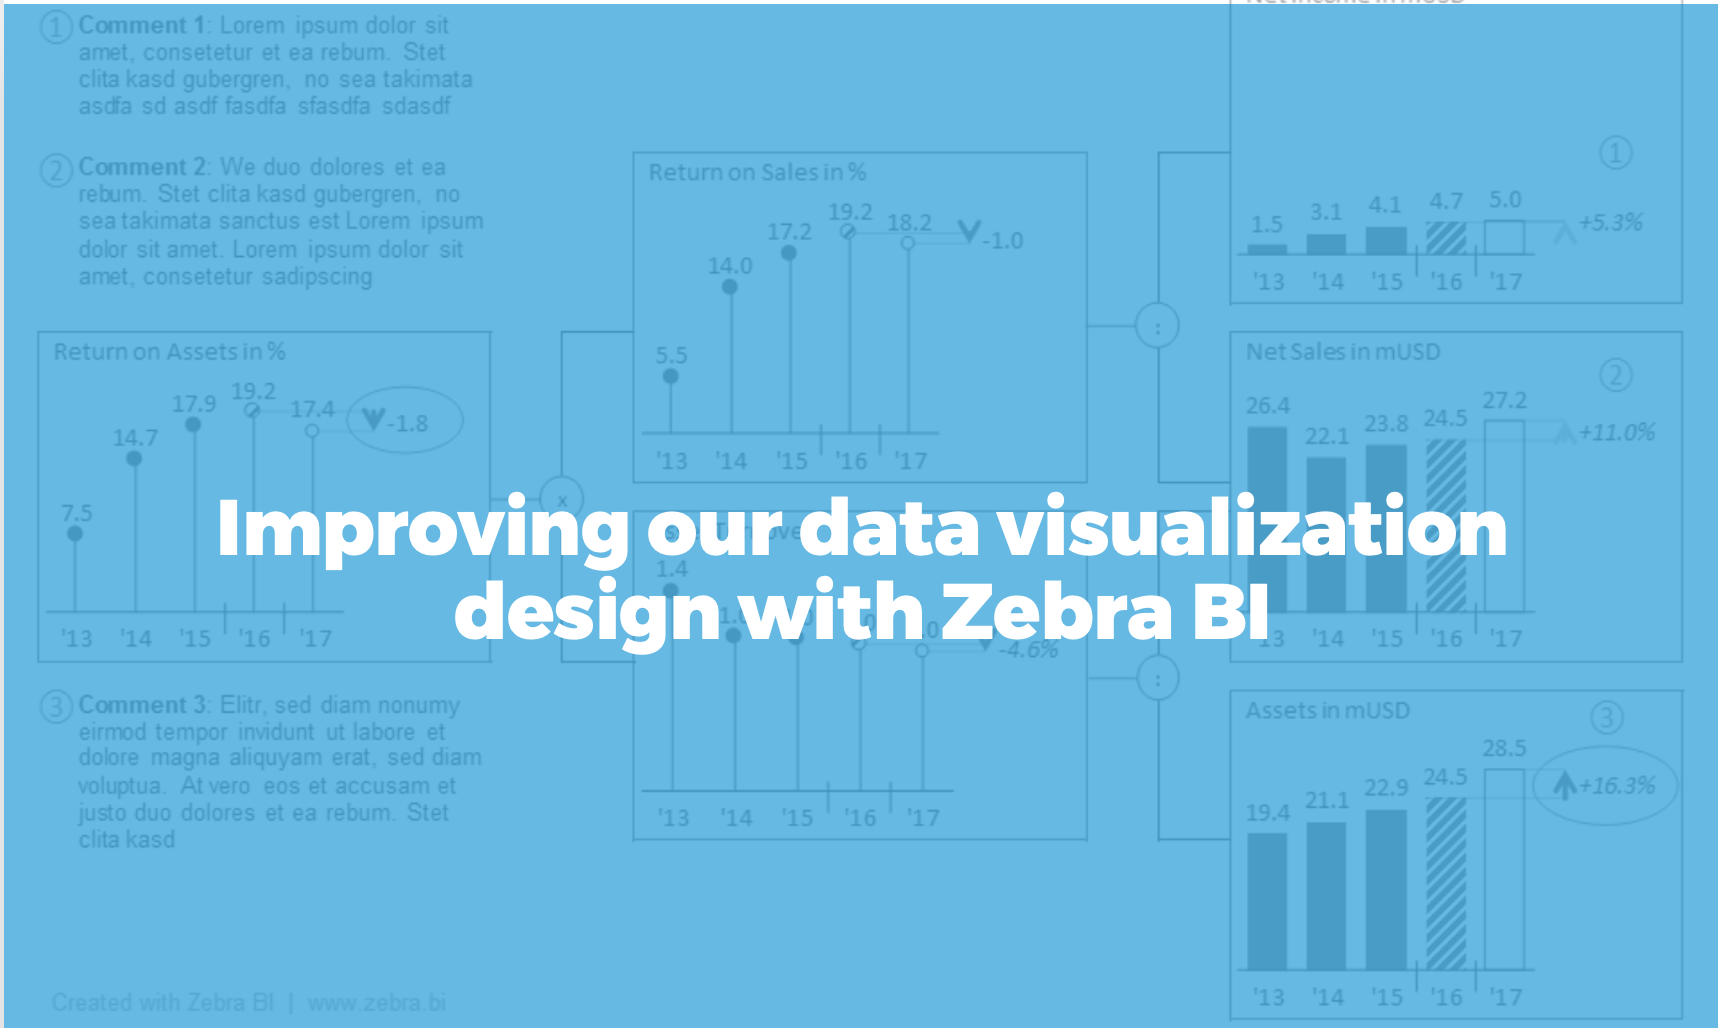
We are very excited to announce that Bismart has recently partnered with Zebra BI. Discover what makes Zebra BI's visuals so amazing!
At Bismart we develop business solutions with a strong technological base. Much of our work is to facilitate the understanding of the data stored in companies so that they can make decisions based on them, as well as make predictions for the future. We have been developing these solutions with Power BI since the preliminary versions and even before, with the Power Query, Power Pivot and Power View solutions of Excel.
We have always paid special attention that our Power BI solutions offer an adequate response in three main areas: business, communication and technical quality. To do this we always work with the best platforms and suppliers, such as Microsoft or, more recently, Zebra BI. Zebra BI is a reference provider of Power BI and Excel visuals that allow you to visualize data in a clear, concise, simple and attractive way - even Microsoft uses them for its internal reporting!
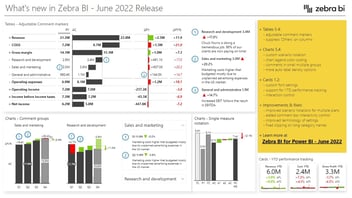
Zebra BI visuals are especially ideal for finance, marketing and sales. They allow you to create all the charts a financial expert might need to explain business performance in detail, as they allow you to generate easy-to-use revenue and profit and loss reports in Power BI with subtotals, cost reversal function, reorderable columns, automatic deviation charts, etc. Zebra BI Tables is, by far, the most powerful visual table/matrix in Power BI. It allows to construct extremely flexible tables with embedded graphics, expand and contract rows, reorder columns, make profit and loss calculations, top N analysis and much more.
Thus, with the incorporation of Zebra BI visuals in our solutions we go one step further in the visualization of data and further improve our reports, mainly in the financial area.
Zebra BI brings the following advantages to our solutions:
- Useful, relevant and easy to use visuals and reports.
- They allow you to add an unlimited number of levels to the hierarchical tables and drill down to the smallest detail.
- Visuals officially certified by Microsoft. This means that Microsoft guarantees the proper functioning and security of Zebra BI visuals, as well as full compatibility with Microsoft platforms. In addition, the certification allows to offer more and better options.
- Maximum flexibility in the design of table-based reports and complete decision-making power over the design and behavior of Zebra BI visuals in Power BI reports and dashboards.
- Intuitive reporting thanks to Zebra BI's ease of use
- Zebra BI visuals are the first to be fully responsive: fully flexible and intuitive business charts and graphs that automatically adapt to the designated space.
In addition, it offers the following possibilities:
- Automatic Variation Charts
- Variation charts, waterfall charts, bar charts, lollipop charts...
- Profit and loss calculations with subtotals
- Flexible table/matrix designs
- Sort by any column with one click
- Expand/collapse rows at unlimited levels
- Rearrange columns by dragging
- Top N and other analyses
- Matrix Graphics
- Hide/Show Columns
- Column Hierarchies
- Customizable design
- Custom number formats
- Works on Report Server, mobile applications
We at Bismart are very satisfied with our recent partnership with Zebra BI. We are convinced that thanks to this our reports and solutions, especially those focused on finance, will see their design and possibilities improved, which guarantees an even better quality product for the final customer.