Zebra BI visuals have arrived to Excel and PowerPoint! Discover the full capabilities of Zebra BI Office, a game-changing solution.
Last Tuesday we celebrated the official launch of Zebra BI Office, which provides Zebra BI visuals for Excel and PowerPoint. Zebra BI Office takes us one step further down the journey towards the democratization of data visualization and BI analytics.

Last Tuesday, October 18, Zebra BI held a live event to present what promises to be a before and after in the world of data: Zebra BI Office. Zebra BI Office is the ultimate integration between Zebra BI, Excel and PowerPoint, something that users —especially Excel users— have been waiting for the longest time.
Zebra BI Office is much more than a new solution and promises to be a giant step towards the democratization of business analytics and data visualization.
Zebra BI Office enables Zebra BI visuals, until now only available in Power BI, in two of the most widely used Microsoft platforms: Excel and PowerPoint.
➡️Explore what you can achieve with Zebra BI Office for Excel by downloading the official Zebra BI for Excel templates, including the following reports:
- Sales Annual Variance (PY, AC, PL, FC)
- Sales Monthly Variance (PY, AC, PL, FC)
- Cost Variance Table (PY, AC, PL, FC)
- Income Statement
- Cash Flow Statement
- EBIT Contribution Analysis
- Price Volume Mix
- Subspription Business Model
- Marketing Budget Variances
Everything we know about Zebra BI Office
Zebra BI Office brings all the capabilities of Zebra BI for Power BI to two new environments: Excel and PowerPoint.
Zebra BI visuals for Excel
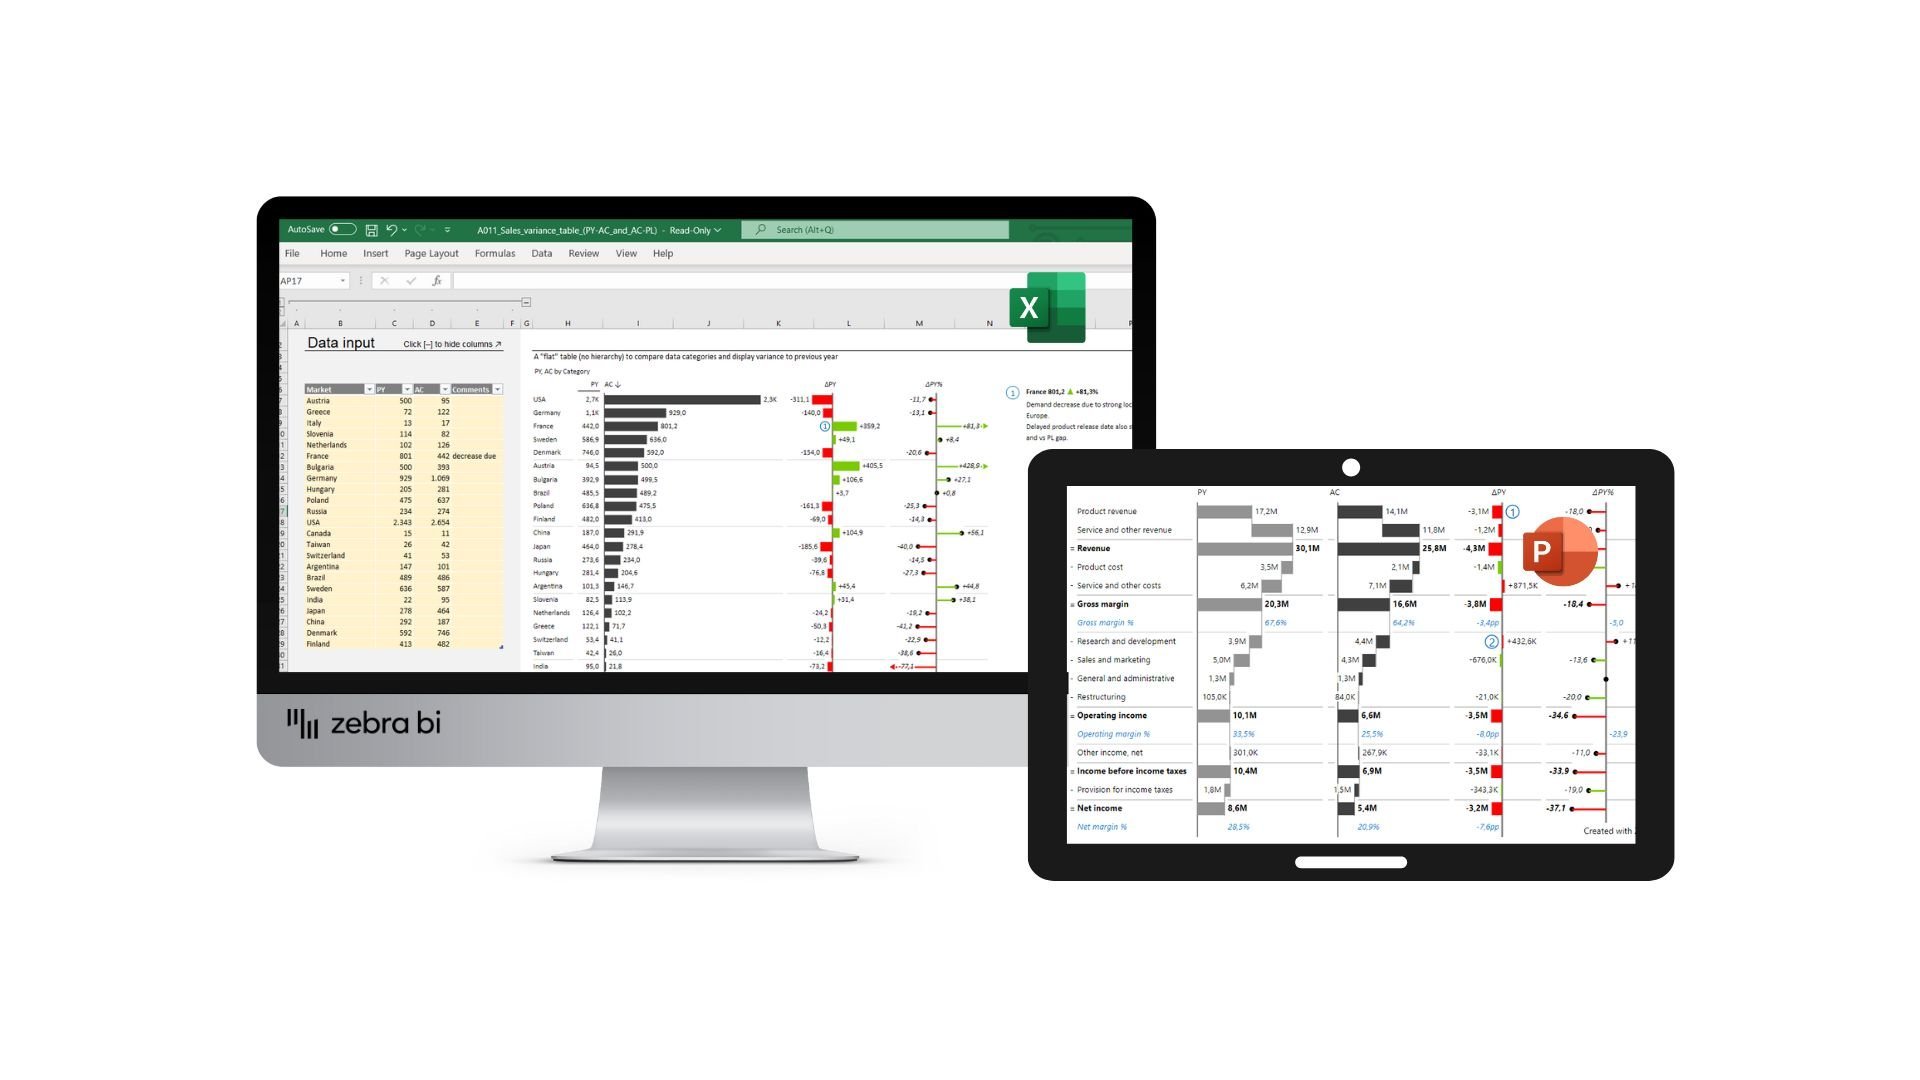
The integration between Zebra BI and Excel solves what is probably Excel's weakest point: data visualization.
Excel is still the most widely used analytical tool by organizations. While it is not a business intelligence tool, the truth is that many companies use it as such.
Although, over the years, Microsoft has been updating Excel to bring it closer to the world of business intelligence, the advances in terms of visualization have been minimal. Excel is a fundamental and extremely necessary tool, but its possibilities in terms of data visualization are insufficient. Excel's visuals are not designed to promote business decision making, understanding, data communication and reaching conclusions in short periods of time. In short, Excel is not the right tool for creating actionable reports.
Until now.
Source: Zebra BI
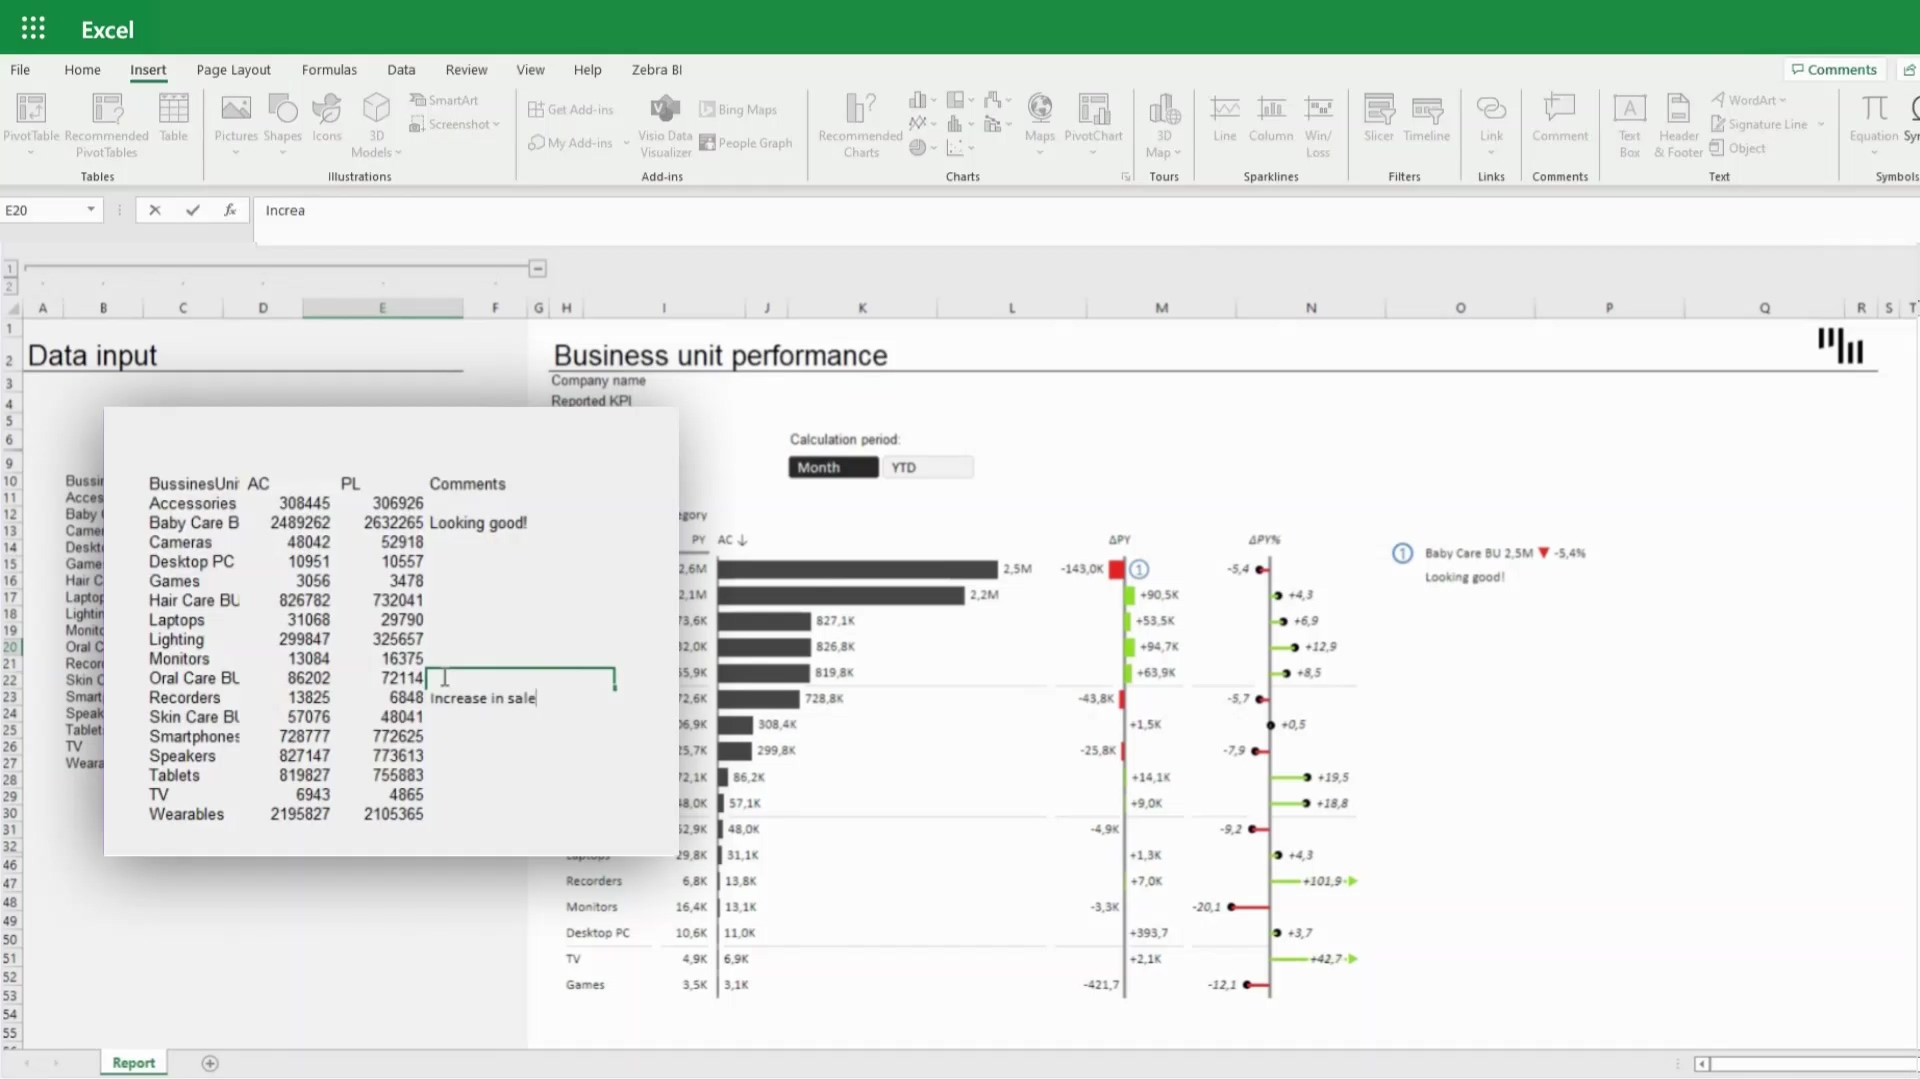
Zebra BI Office for Excel solves the biggest shortcoming of Excel users through two add-ins: Zebra BI Charts and Zebra BI Tables.
- Zebra BI Charts: It has all the visuals and charts of Zebra BI for Power BI, maintaining responsive and interactivity functionalities. Zebra BI Charts visuals for Excel enable automatic calculation of deviations from PY, plan or forecast, as well as growth rates and totals. In addition, they are interactive and intelligent visuals, which adapt the data displayed in the visual to its size. That is, when we make a smaller visual, the information displayed in the visual shrinks and, if we make it larger, more detailed information is displayed.
- Zebra BI Tables: Enables the visualization of structured data, both in table and chart format with integrated deviations, just like in Power BI.
All the new visuals and charts contain Zebra BI's toolbar, which provides complete design and creation freedom to users. Zebra BI visuals allow you to modify the layout, add and edit formulas, render variances and add comments directly from the visual.
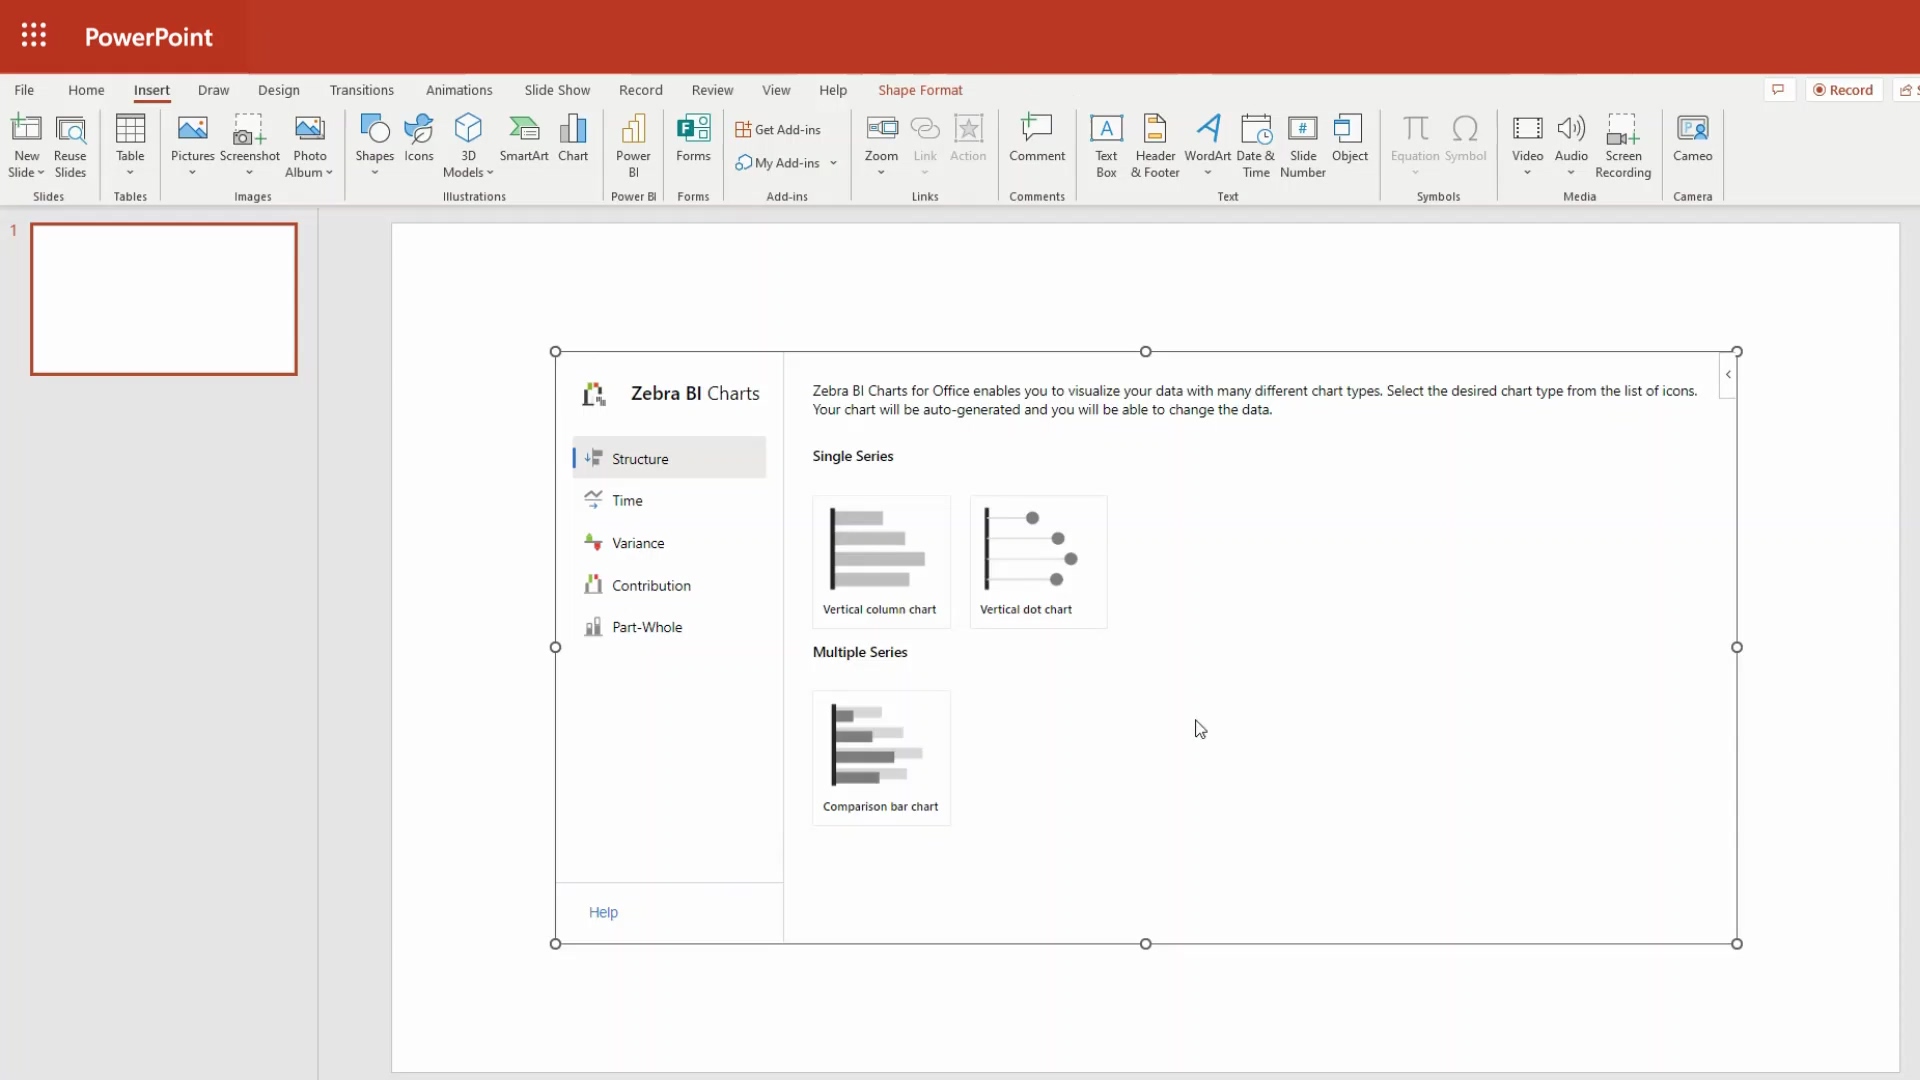
Zebra BI visuals for PowerPoint
Zebra BI Office for PowerPoint enables the same functionality as Zebra BI for Excel, but in PowerPoint.
Zebra BI has invested in this integration with the intention of enabling companies to improve their business and internal presentations. Having such powerful visuals in a platform as used as PowerPoint provides the ability to communicate data in a much more visual, attractive and understandable way.
Source: Zebra BI
Zebra BI Office Highlights
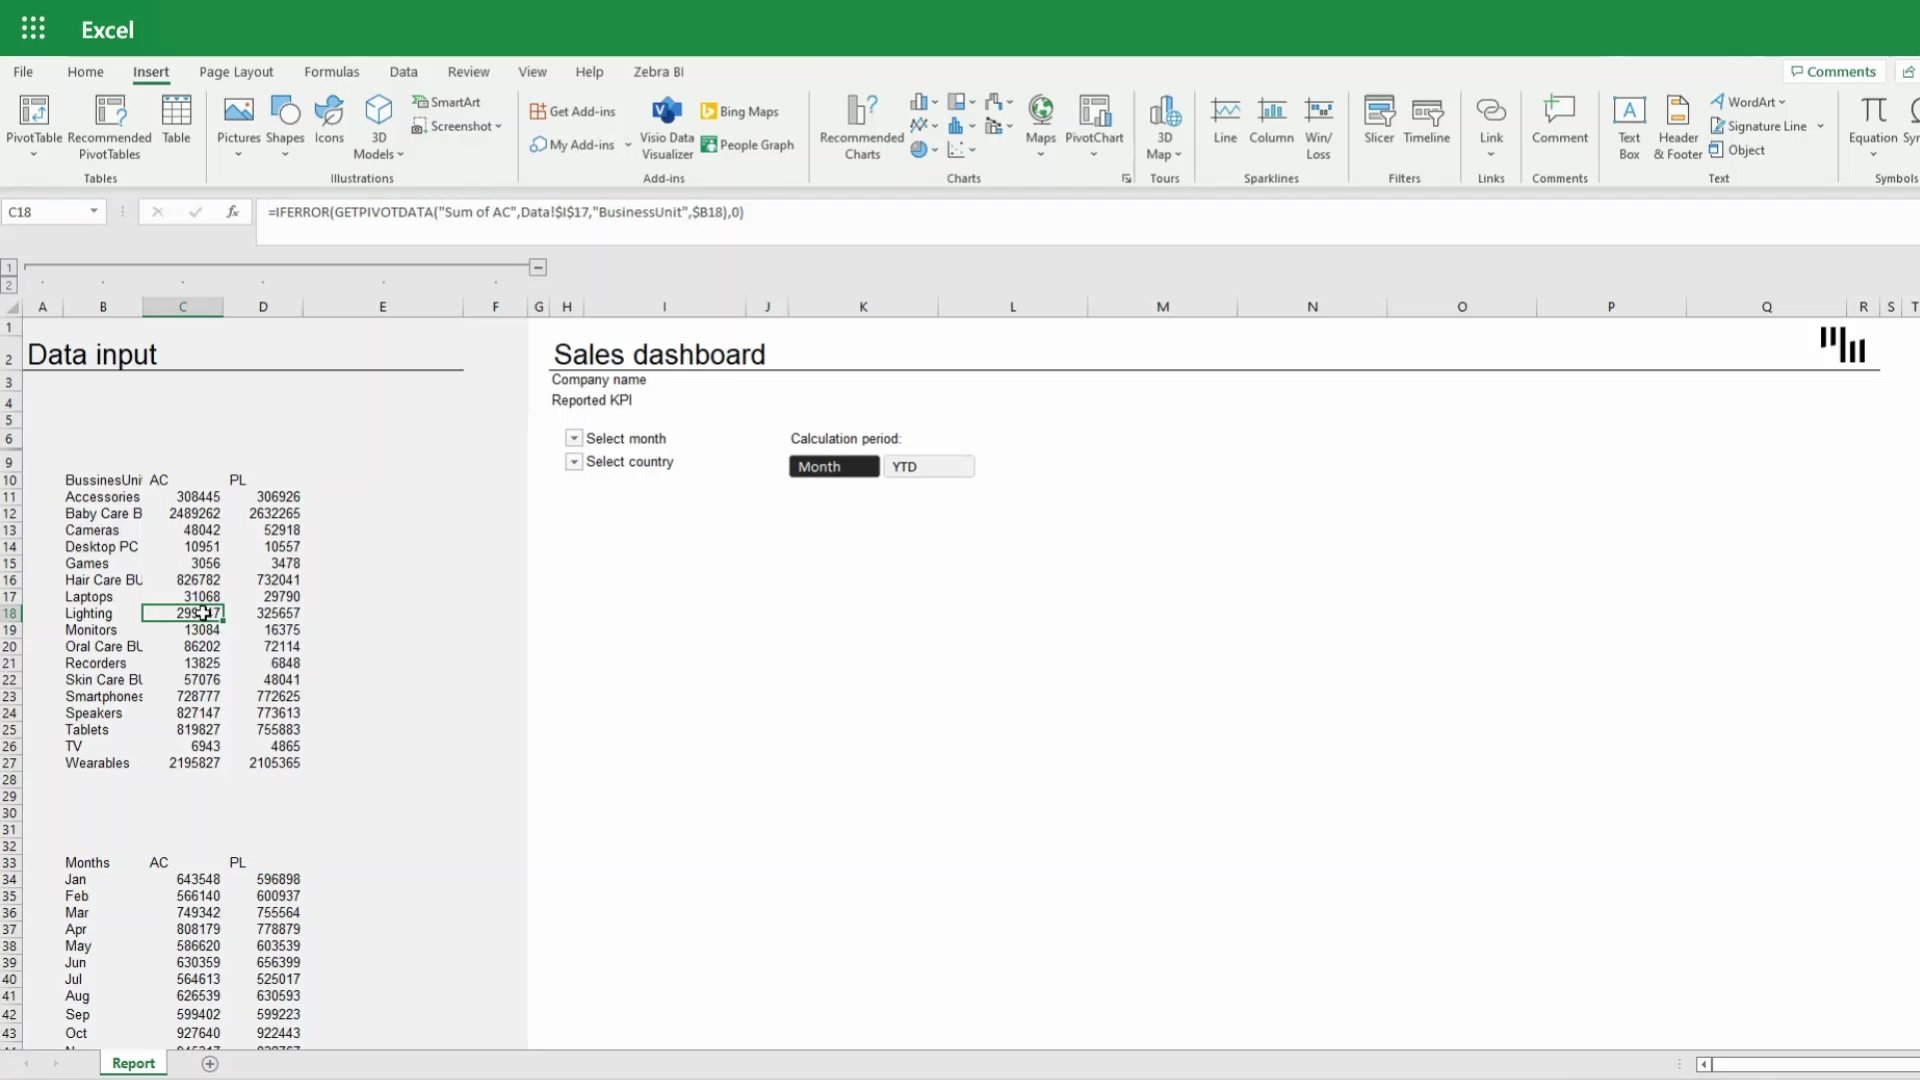
1. Transform data into interactive visuals in a just one click
Without a doubt, the most outstanding advantage of Zebra BI for Excel is that it allows you to create interactive, dynamic, visually appealing and responsive charts in a single click. Zebra BI converts the numbers in your Excel files into advanced charts and tables automatically. No exaggeration, to create the visual you just select the data and click "create visual".
- Small multiples: Zebra BI charts have the most advanced algorithms on the market for rendering small multiples.
- Dynamic comments: All Zebra BI visuals come with the ability to add dynamic comments within the charts.
- Zebra BI Cards: Zebra BI Cards allow you to add as many KPIs as needed in a single visual, without affecting reports rendering and loading time.
2. Visualization of deviations
As we always say, data is not information. For data to be information, it must be put in context.
Zebra BI visuals and tables calculate absolute and relative variances automatically so you don't have to do the calculations yourself. In addition, deviations are displayed in the visuals, contextualizing the data and contributing to the generation of knowledge.
Enrich your presentations and reports by showing data in its context and helping business users to draw conclusions in seconds.
3. Create advanced analytics reports
Zebra BI for Excel makes it easy to create advanced reports, giving users the ability to design multiple charts within a single visual. It also imports Power BI's own complex pivot tables into Excel and PowerPoint, bringing both tools closer to the BI world.
4. Don't just make decisions, make the right decisions
The ability to add comments to the visuals is the ideal resource for senior management to quickly understand the data and not even have the ability to draw the wrong conclusions when reading the data.
Zebra BI's dynamic comments automatically update when users make changes to the data.
Zebra BI Office for Power BI users
The mythical rivalry between Excel and Power BI is more a myth than a practical competition. In our post "Excel vs. Power BI" we already explained that they are platforms that do not serve the same purpose. In fact, Microsoft encourages the use of both tools together as part of a company's business intelligence hub.
In this regard, Power BI users will also benefit from Zebra's integration with Excel and PowerPoint.
With the new add-ins, users who work with Power BI on a regular basis will now be able to import their Power BI datasets directly into Excel. They will not have to create copies of the datasets to, for example, create a pivot table in Excel. This option, in addition to promoting data security and data governance, contributes to having a single version of the truth in all business tools.
The democratization of prescriptive analytics and actionable reporting in the business world
In addition to explaining what Zebra BI Office is and the new possibilities it unlocks, we do not want to end this article without talking about the significance of this launch.
At Bismart, as Zebra BI partners, we are particularly excited to see how far the benefits of Zebra BI have come and the impact this new launch will have on the corporate world.
In recent years, descriptive analytics and predictive analytics have merged to give way to prescriptive analytics. Descriptive analytics allow companies to know what has happened so far and predictive analytics allow them to predict what will happen in the future. Prescriptive analytics, on the other hand, help them figure out what they should do next. Right now, prescriptive analytics are a must.
However, prescriptive analytics needs data visualization, and this is where Zebra BI for Excel and PowerPoint promises to be a game changer.
In the world of BI and data analytics we are used to business intelligence tools that enable advanced analytical and reporting functions. However, outside our world, that just doesn't happen.
Despite not having been created for it, Excel is still the most widely used BI tool by companies. In practice, companies are not very data-driven and most business users still communicate data by copying and pasting gigantic Excel tables into PowerPoint presentations. Same thing happens in team meetings and business presentations, which can lead in companies losing money.
- Poorly planned meetings had a cost of $399 billion in 2019
In business meetings and presentations, timing and communication are everything. Business users need to understand information in seconds. Now, thanks to Zebra BI, business users can create meaningful visuals and generate business intelligence and make data-driven decisions in a single click.
Beyond making life easier for users already familiar with Zebra BI and other BI tools such as Power BI, Zebra's visuals in Excel and PowerPoint bring data analytics, business intelligence and data visualization closer to users who are not used to them. Therefore, Zebra BI Office contributes to the democratization of data and promotes the development of data-driven business cultures.
Conclusion
Zebra BI Office is a big step towards the democratization of data in the corporate environment.
Zebra BI visuals solve Excel's shortcomings in terms of data visualization and make it easier for users to get business insights without leaving the platform.
As for PowerPoint, creating presentations with actionable charts and interactive tables it is now easier than ever. Zebra BI Office will transform business meetings and presentations into a complete experience.
➡️Don't forget to try Zebra BI Office for yourself! Download the Zebra BI report templates for Excel now: