Power BI and Excel are two of the most widely used data analysis tools. We compare them and explain which one is the most suitable for you.
In today's business world, having tools that allow us to quickly and intuitively analyze data and transform databases into understandable information is fundamental. More and more companies are realizing the importance of data analysis and its relationship to improving performance and increasing profits. That is why choosing the right tool, so that experts can get the most out of their work, is so important. Excel and Power BI are two of the most popular data analysis applications in the world, but which one is better?

In this article you will find...
- Excel: Strengths and Weaknesses
- Power BI: Strengths and Weaknesses
- Comparison: Power BI vs Excel
- Main differences between Excel and Power BI
- Conclusion
Both Excel and Power BI belong to Microsoft and are used for data processing and analysis, although they have different capabilities.
Excel, which is part of Office 365 and was released in 1985, is a program known by virtually everyone. Whether or not you are an expert in data analysis and whether or not you work with data, you have almost certainly used Microsoft Excel at some point. The program has the format of a spreadsheet that distributes data into rows and columns and has the ability to perform calculations and mathematical formulas easily and quickly. In addition, like Power BI, it is also used to transform data sets into visual information.
On the other hand, Power BI is a set of tools, software services and business intelligence applications oriented to business. In other words, Power BI is a platform with a more specific objective than Excel —data processing in business environments— although it can also be used in other sectors. One of the great advantages of Power BI is that it is able to connect with a large number of data sources of many sizes: Excel spreadsheets, relational and non-relational databases, cloud services, files in different formats, Big Data tools, web applications, etc. In addition, it has high graphic and data transformation capabilities in reports, dashboards and customized, attractive, interactive and easily understandable visualizations.
Does your company have the best Power BI dashboards of 2021? Download our e-book with the 15 best Power BI dashboards!
Download e-book
Thus, Excel and Power BI have many similarities: both can access data in different formats and convert them into visual information. Also, both Excel and Power BI are updated regularly and include improvements and new possibilities in each new version.
So, what are their differences? First, we will describe the strengths and weaknesses of each of the applications.
Before starting, we must make it clear that the capabilities and functionalities described below refer to the use of the applications by end users. Furthermore, when we talk about Excel we are talking about the traditional program, without referring to the inclusion of the Power modules that provide Excel with some of the advanced options typical of Power BI.
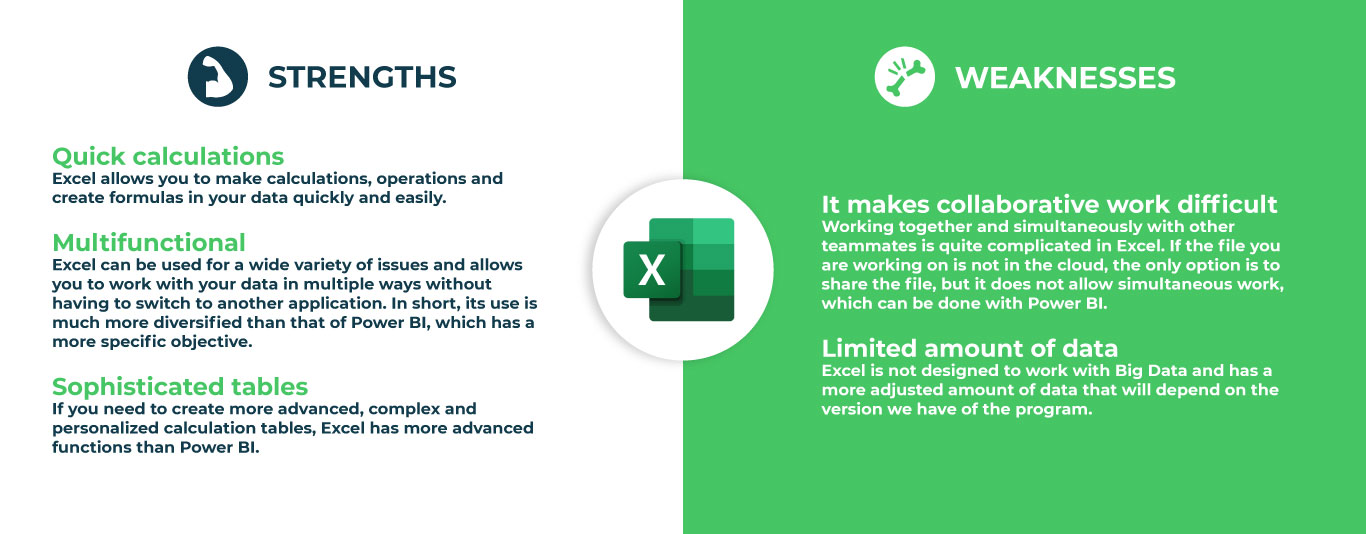
Excel: Strengths and Weaknesses
Power BI: Strenghts and Weaknesses
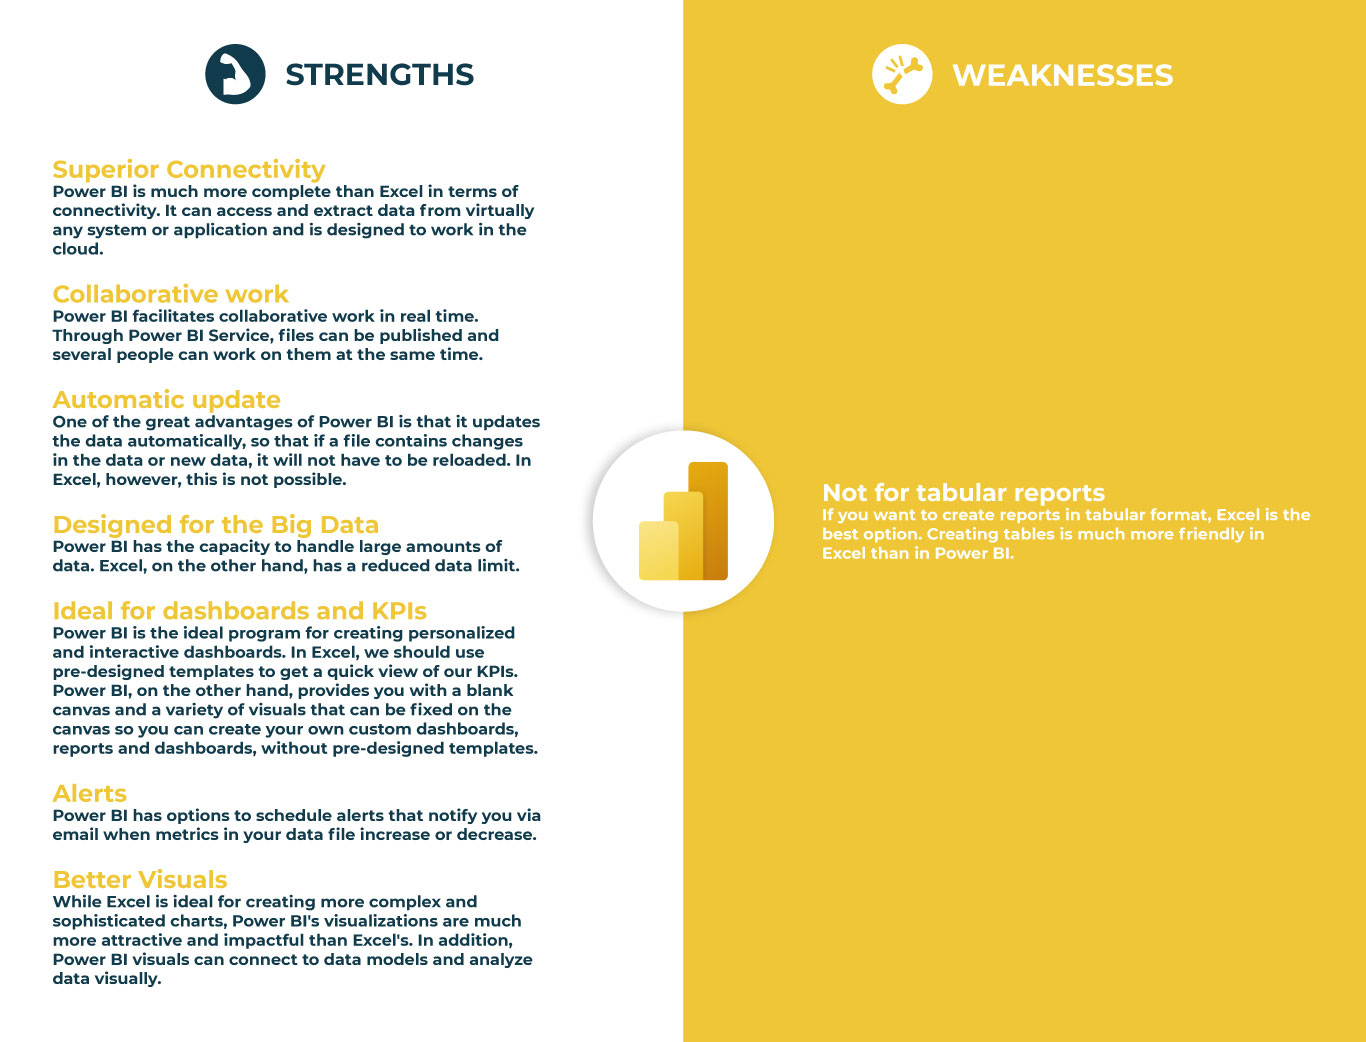
Beyond the image above, Gartner notes that another of Power BI's weaknesses is data governance. As organisations accumulate reports and users working in the application, governing the Power BI environment can become very complex, which in turn can affect the productivity of Power BI users and therefore the business.
At Bismart, as a Microsoft Power BI partner, we have a suite of tools for Power BI that solve the data governance problems of the application, as well as promoting productivity and saving resources invested in Power BI.
Comparison: Power BI vs Excel
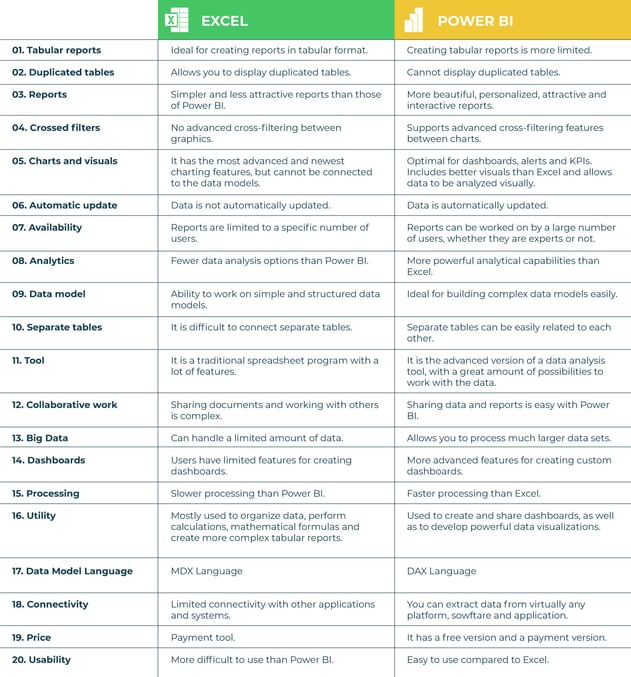
Below we show a comprehensive comparison of the technical capabilities and functions of each application:
Main differences between Excel and Power BI
- Excel is used to organize data, transform it and perform mathematical operations and calculations. On the other hand, Power BI was conceived as a business intelligence and data visualization tool for businesses.
- Excel has limitations in the amount of data it can work with. In contrast, Power BI can handle much larger amounts of data.
- Power BI can connect to a large number of data sources, while Excel's connectivity capacity is limited. Also, unlike Excel, Power BI can be easily used from mobile devices.
- Power BI has faster processing than Excel.
- Power BI dashboards are more visually appealing, interactive and customizable than those in Excel.
- Power BI is a more powerful tool than Excel in terms of comparison between tables, reports or data files.
- Power BI is more user friendly and easy to use than Excel.
Conclusion
After analyzing both tools in depth, we can conclude that both Excel and Power BI are very complete platforms to work, analyze and process data. However, they have different characteristics and functions.
To claim that one tool is better than the other would be to venture a lot, since their potential will depend on what you need to do with your data. Excel is a better option if you want to manipulate and transform data, do searches, calculations and apply mathematical formulas or create complex tabular reports. Power BI is more suitable for working with Big Data, creating visualizations, working in teams, integrating data from multiple sources and, analyzing data with the intention of getting indicators, drawing conclusions and making data-driven decisions.
Basically, Excel allows more operations with data than Power BI. In other words, it has more diversified functionality and is an ideal program for expert data analysts.
In contrast, Power BI is a more complete application in other ways and is ideal for businesses and companies that need to analyze large amounts of data in a simple way, work collaboratively, transform data into insights, update data regularly and present information visually.
At Bismart, Microsoft's Power BI partner, our experts work with both Excel and Power BI.
In short, if you are debating between one tool or another, you should be very clear about what actions you need to take and review the comparison table in this post to determine which one is more suitable for you. For example, some of the questions you need to ask yourself are:
- Do I need to do thorough and comprehensive data analysis? If so, Power BI is the best option.
- Do I need to create reports in tabular format? In this case you should use Excel.
- Do I need my team to work collaboratively? Choose Power BI.
- Do I work with large amounts of data? Power BI will be more useful to you.
- Do I find it more necessary to create complex or visually attractive and interactive visualizations and graphics? In the first case, choose Excel. On the contrary, Power BI is more suitable.
- Do I work in Business Intelligence? Then Power BI is the ideal application for you.
What tool do you prefer? If you know and/or have worked with both, let us know which one is your favorite in the comments and why. We will be happy to generate debate and hear different opinions! Don't forget to download our e-book with the 15 best Power BI dashboards!
