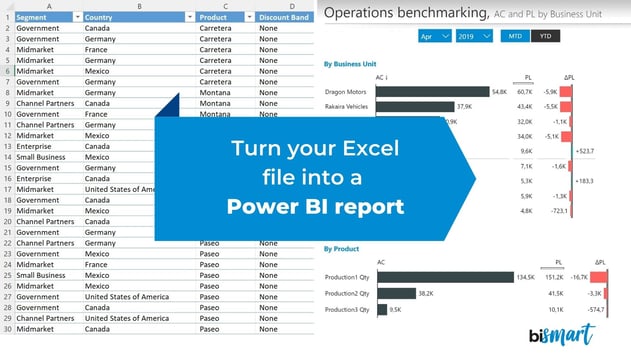
Learn how to go from Excel to Power BI in 6 steps! Convert your .xlsx files to .pbix and create complete Power BI reports with our guide.
Excel and Power BI are two of the most used Microsoft tools in business. Although both are useful for processing data, they have different purposes. Here's how to transform an Excel file into a Power BI report in only 6 steps.
More and more companies are looking for professional profiles with expertise in data processing and data analytics. Nowadays, pretty much all companies need qualified professionals that help them transform data into information that supports data-driven decisions. Thus, business intelligence, data analytics and data visualization tools have become essential.
Microsoft is currently leading the BI and analytics tools market thanks to Power BI, the most comprehensive and strategically insightful business intelligence platform on the market, according to Gartner. However, Excel is undoubtedly Microsoft's most used data processing tool and probably one of the most tools in general.
Excel or Power BI: What tool should you use?
In this blog we have already explored the differences between both tools, providing a complete comparison between Excel and Power BI and their functionalities. As we concluded in that article, it is not accurate to say that one tool is better than the other, as they serve different purposes.
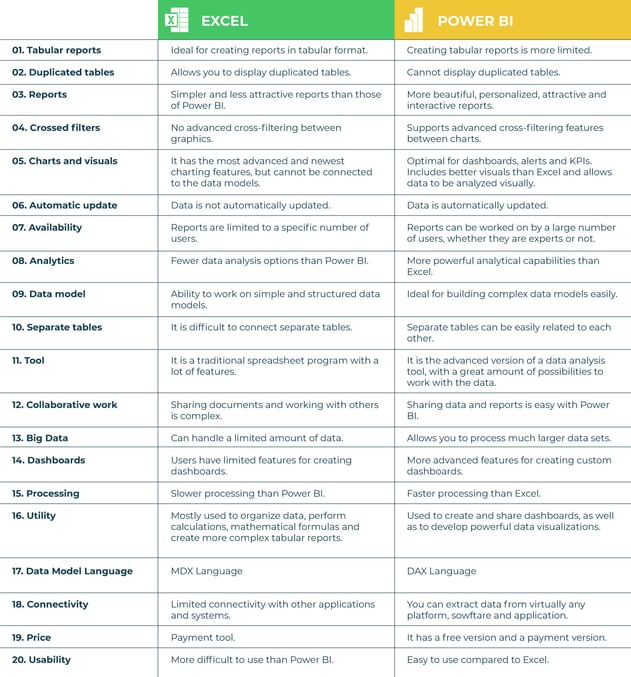
Excel is probably one of Microsoft's best tools as well as one of the most used. However, Excel has a generalist approach and is made for working individually. Excel spreadsheets are focused on statistical analysis and are ideal for creating tabular reports.
Power BI, on the other hand, is a business-focused platform designed exclusively for enterprise use. Power BI was conceived for companies to generate business insights from data, as well as to transform data files into stories that promote decision making. Stories are built through reports and dashboards that lead to conclusions for the definition of better strategies. Power BI encourages collaborative work and allows multiple users to work on multiple reports using the same data set at the same time. Power BI is the ideal business intelligence platform.
Ultimately, Power BI and Excel serve different purposes.
Power BI allows companies to transform data into complete stories through customizable reports and dashboards that contain visual objects and interactive, navigable charts. Excel, on the other hand, presents data in tabular format, and while we can create charts in Excel, the process is much more complex than in Power BI.
In short, Excel is for individual statistical analysis. Power BI is for data visualization and business intelligence generation at the enterprise level.
How to transform an Excel file into a Power BI report?
We can use Excel files to create a report in Power BI, but we can also import data in many other formats.
Transforming an Excel file into a Power BI report is not too complex. However, in order to learn how to do it, it is necessary to follow the correct steps to avoid getting lost in the process. For this reason, we have created a specific guide with the 6 steps you must follow to transform your Excel file into a Power BI report, where you will find a detailed description of the steps to follow.
You can download the guide below for free.
What can you do with Power BI?
There is a good reason why Power BI is the leader of the business intelligence market. Its business perspective and its analysis and visualization possibilities, in addition its collaborative environment, make of it an essential tool for monitoring business activity.
At Bismart, as a preferred Microsoft Power BI partner, we use Power BI's suite of services for the design and development of our business solutions.
Some of Power BI's most valued capabilities are:
- Enables data integration from virtually any source and processes data in a wide variety of formats.
- Transforms data into attractive, dynamic and interactive visuals.
- Promotes collaborative work and the sharing of documents, information, reports and data sets.
- Allows you to create complete stories and to analyze data in a single view.
- It connects with most corporate platforms.
- It has an integrated security system to protect data.
👉Learn how to increase the security of your Power BI environment by implementing data governance policies to Power BI.
The main advantages of using Power BI
- Highest connectivity: Power BI is one of the most cutting-edge tools in terms of connectivity and definitely comes with greater integration possibilities than Excel. It is designed to work in the cloud and can extract and import data from a large number of systems.
- Encourages team work: Power BI Service allows users to publish their reports in collaborative workspaces so that multiple people can work on the reports.
- Everything in real-time: Power BI automatically updates data and reports. So, if a user is creating a report from a data set that has been modified, the report will automatically update the data so that the user doesn't have to reupload the file.
- Advanced processing: Power BI is designed to work with Big Data and has superior processing capabilities than Excel.
- Ideal for reporting and visualizing KPIs: Power BI is the perfect tool for visualizing data and performance indicators through dashboards and dynamic reports. To visualize KPIs in Excel we must use a pre-designed template and getting there is quite complicated. Power BI, on the other hand, provides a blank canvas on which you can transform data into whatever you want: tables, visual objects, dashboards, full reports, etc.
- It has the best visuals: Power BI visuals are among the most powerful on the market and definitely much better than Excel's. Excel is great for tabular reports, but data visualization is not one of its strengths.
- Customizable alerts: Power BI includes an alert system that informs you everytime the system detects an anomaly within data.
Now it's your turn! Transform your Excel file into a Power BI report in 6 steps: