Here at Bismart we are specialists in dashboards generation services. Do you know why they are so important? In this article we tell you all about them.
More and more organizations make their decisions based on dashboards that help have a better visibility of results and control over their business processes.
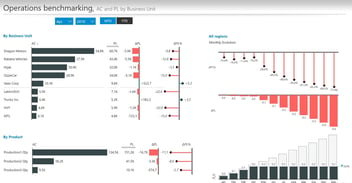
All this thanks to the monitoring and analysis of key results (KPI's) or performance metrics, so they can be used for any type of industry and activity.
What is not defined cannot be measured. What is not measured cannot be improved. What is not improved is always degraded.
Lord Kevin

Dashboards
There are multiple dashboards: from strategic, comprehensive or top management dashboards for the monitoring of strategic objectives and indicators to departmental dashboards for the analysis of the results of the different functional or management areas: finance, sales, purchasing, marketing, human resources, logistics, production... to operational dashboards for the monitoring of results in real time.
The Benefits
The advantages and benefits of dashboards and dashboards are multiple, including the following:
- They offer objective information about the performance of the company and offer a solid knowledge base on which to make data-driven decisions.
- The objective information in the dashboards shows areas and points for improvement within the company, so that management can make changes as needed.
However, without a suitable technological solution, implementation is tedious and has many drawbacks:
- Significant efforts each month for manual reporting.
- High probability of error when performing calculations manually (Excel).
- Discussions in the committees as to whether the data is correct or not, if I have obtained it from one site or another, or if it has been calculated in one way or another... Instead of focusing efforts on analyzing the results and making decisions, the meetings focus on the interpretation of the data.
- Information is not up to date or available when required.
- A static photo is available (in most cases monthly) without the possibility of temporal analysis.
- Very unattractive static reports, with minimal possibilities of interaction or analysis.
What do we do
At Bismart we implement dashboard solutions that not only solve the problems described above, but are also characterized by the following aspects of great value:
- Global solution: portfolio of services that includes all the necessary activities for a successful conceptualization, implementation and maintenance.
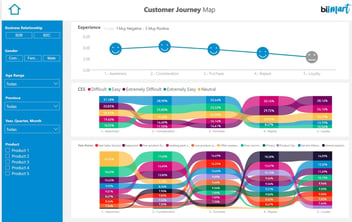
- Detailed user interface: we apply design and usability criteria that help to an easy use and compression of dashboard reports thanks to highly visual, attractive and interactive design elements.
- Top-down approach: first facilitating the monitoring and analysis of the most relevant facts and then delve into the details for better analysis and diagnosis.
- Predictive analysis: thanks to predictive analysis we can detect the projection or trend that our results will follow. In this way we can anticipate possible problems and take appropriate preventive measures.
- Business key data model: Data models are no longer a merely technical component, but are used by users to produce ad-hoc reports or new analyses. For this to be possible, it is key that the different elements of the data models (dimensions, tables, indicators, measurements, results...) speak in business rather than technical terms.
- Facilitate the entry of data that are not computerized such as objectives or budgets.
- Generation of alarms that warn key users of anomalous results or relevant facts.
- Technological solution adapted to each need. From solutions based on Power BI to complete Data warehouse and Business Intelligence solutions with Predictive Analysis and Big Data.
At Bismart, as a partner Power BI of Microsoft, we build our dashboards with Power BI, a powerful tool perfect for business analysis.
- Top Business Intelligence Tools
- PowerBI