What are the advantages of Power BI over other tools? 6 reasons why you should do data analytics with Power BI!
What advantages does Power BI have over other data analysis and business intelligence tools? Here are 6 reasons why you will achieve more advanced data analytics with Power BI!

Microsoft Power BI is the leading data analytics, business intelligence and reporting tool in Gartner's latest Magic Quadrant. Beyond the opinion of a leading global technology consulting company, Power BI is also one of the most widely used data analytics tools by professionals because of its business apprach.
The tool enables data scientists and analysts to turn data sets into engaging, interactive and insight-enhancing reports, dashboards and visuals used to monitor the course of business strategies.
As one of Microsoft's Power BI partners, Bismart has been working with this set of services for many years. Power BI allows us to develop customized solutions for each of our customers.
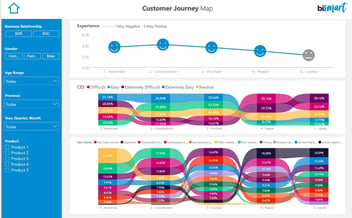
Data analytics with Power BI promotes the discovery of information and the democratisation of data through its unique data visualisation capabilities, that improve the quality of companies' informative systems and help executives make data-driven decisions.
Power BI streamlines data analysts' work and makes it easy to connect, transform and visualise data.
Nevertheless, there are many other similar tools on the market. For example, Excel —also by Microsoft— is another essential tool for data experts. In fact, using Excel and Power BI together is very common. In this blog we have already explored the differences between Excel and Power BI. This time, we look at the reasons why companies and experts continue to opt for Power BI.
6 reasons why you should do data analytics with Power BI
1. Data connection
One of Power BI's greatest advantages is its extensive data connectivity. The tool connects to multiple tabular databases and integrates with a host of corporate tools and systems to make importing and exporting data, dashboards and reports as simple and fast as possible.
2. Data visualization
Power BI is one of the most complete platforms for data visualisation. In the tool's appsource you will find a lot of Power BI visuals validated by Microsoft, but you can also create your own custom visuals.
In addition, Power BI adds new visuals from time to time and you can even extend its visualisation capabilities with Zebra BI, which works both for Excel and Power BI.
3. Advanced analytics
Power BI is the optimal platform for increasing the value of your regular Excel data analysis with advanced analytics. You can enrich business data by ingesting, transforming and integrating data services to other Microsoft suite's tools.
4. Data governance
For anyone who works with data, data governance is a must to ensure the smooth running of any type of process, especially in the business environment, since organisations often have a large amount of data that, when not well organised, can lose all its value.
Power BI includes features that support data control, authority and management. However, the tool has limited data governance capabilities and some organisations require specialised data governance solutions to work with Power BI.
At Bismart we have two data governance solutions that can be integrated with Power BI to multiply the data governance capabilities of companies that work with this set of services.
With Power BI Viewer you can organise your reports by category, assign permissions according to users' role, access all your reports without having a Power BI licence and much more.
With Power BI Analytics you will be able to analyse the activity of all your users with a historical repository with no space or time limits.
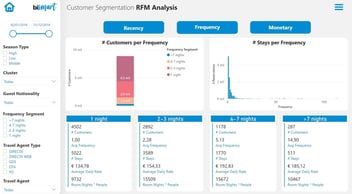
5. Data exploration
Power BI contains extensive data exploration options as well as automated queries. With this tool, discovering insights from data will be much easier. It is also the ideal platform for working with a top-down methodology.
6. UX & UI
Finally, it should be noted that Power BI was conceived as an enterprise tool designed to be used by business users. Clearly, its main users are data analysts and BI consultants. However, the business conception of the platform makes it one of the BI tools with the best usability and user interface. In addition, with Power BI you can adapt your reports to your brande image and automate the process by designing themes that can be applied to all your reports.
Find out how to design themes in Power BI with our E-book: How to create and customise themes in Power BI?!
In short, Power BI is not one of the leading data analytics and BI technologies by accident. Its business focus has made it the ideal tool for companies to transform data into intelligence and enrich the decision making process.