We review the most important new features of the latest Power BI November 2021 update and explain how to configure the new functions.
This November Microsoft has announced several new features in its data analysis and data visualisation platform Power BI. Discover the 6 most important updates to the platform and how to configure them.

Power BI is undoubtedly one of Microsoft's leading data analytics technologies. The suite of services, specially designed to meet companies' business needs, is the ideal tool for creating reports and dashboards, as well as for data visualisation.
A few days ago Microsoft announced the latest updates to the service. As a preferred Power BI partner of Microsoft, we always try to inform you about all the news related to this set of services. On this occasion we review what, according to our team of business intelligence experts, are the most relevant new features of this latest update.
A redesigned format pane, new visuals, new connectors and much more. Don't miss it!
Top 6 new features in the latest Power BI update - November 2021
1. The format pane gets a makeover
Power BI ha cambiado el diseño de su panel de formato. El equipo de Power BI ha tenido en cuenta las opiniones de los usuarios de la plataforma y ha rediseñado el aspecto del panel de formato para optimizar la experiencia de usuario y facilitar la creación.
Power BI has changed the design of its format pane. The Power BI team has listened to their users feedback and redesigned the look and feel of the format pane to optimise the user experience and make creation easier.
The new design does not only replace the format tab icon, but also includes a descriptive caption to make it easier for users to find. The new Power BI format pane looks like this:
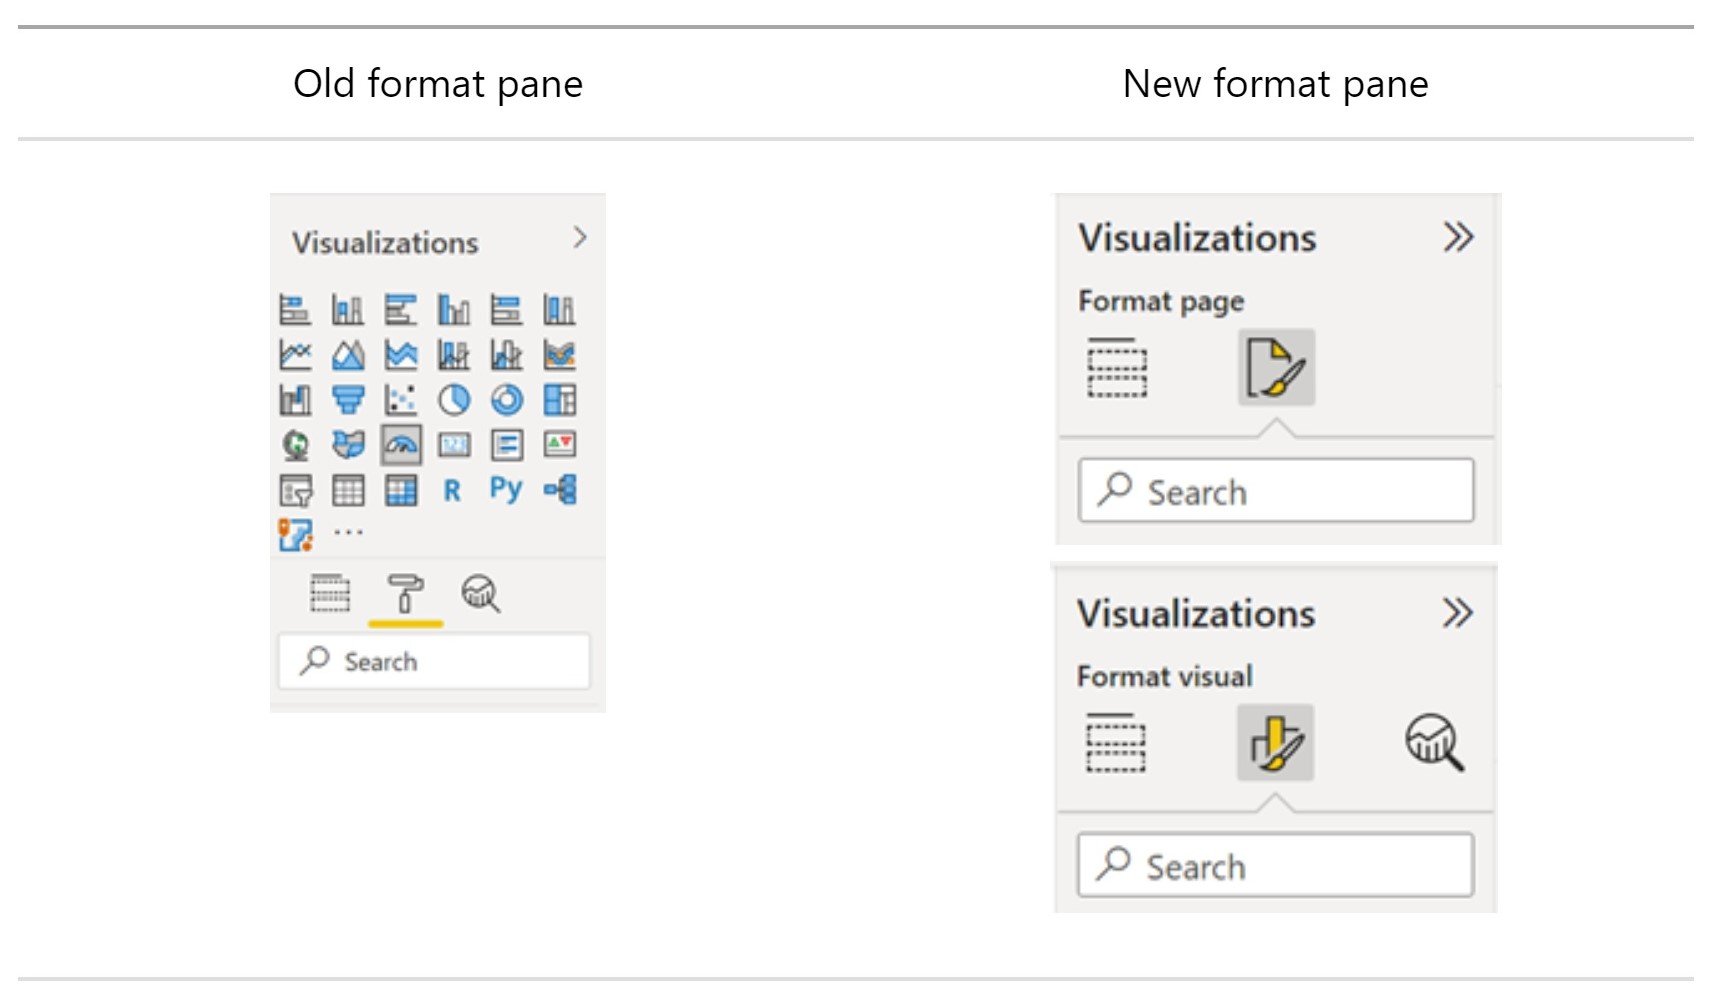
As we can see in the picture, the visualization types gallery has been moved to the "Build" tab in response to the limited space in the format pane. Also, the formatting cards are now divided into two categories: visual specific and general settings. Visual specific settings include those cards that apply to the type of visual you are currently working with.
Undoubtedly, one of the great improvements of the new formatting panel is that it gets rid of the two scrollbars. From now on, when we expand cards and subcategories, we will have a single scrollbar.
On the other hand, default settings can now be automatically reverted in the new format pane button "...".
Finally, the new pane allows you to view hidden dynamic cards and to easily switch between updating the settings for all series or for a particular series without having to scroll.
Ready to see all the new changes for yourself? Activate the preview of the new pane: File > Options and settings > Options > Preview Features > New format pane.
2. Two new navigators: Page and bookmark navigators
Prior to the new update, users who wanted to set a customer page or bookmark navigation experience had to set up each individual button for every page or bookmark. Power BI solves this problem with two new navigators: the page navigator and the bookmark navigator which make it easier to create personalised navigation experiences.
You can activate the new feature in: Insert > Buttons > Navigator.
3. New dashboard visual and new visuals available in the AppSource
Power BI has designed a new dashboard visual that can be added to Power BI reports to help companies integrate business goals, performance indicators, KPI and dashboards into Power BI reports.
This new visual allows users to easily integrate a dashboard into a report as well as update their business goals. In addition, goals can be created in Power BI Desktop and dashboards can be customised to fit the design of the report.
Por otro lado, Power BI se renueva con 2 nuevos visuals que ya se pueden descargar en la AppSource de Microsoft:
Power BI has also introduced 2 new visuals that can now be downloaded in the AppSource:
In addition, Charticulator has also released a new version that incorporates new features such as support for the images table and symbol rotation or the introduction of a new categorical legend scale editor, among many other things.
4. New data connectors
Power BI extends its connectivity with new data connectors and by updating some of the existing connectors.
The new Power BI data connectors are:
- Azure Synapse Analytics: The Azure Synapse Analytics Workspace Connector (Beta) is now available in preview mode.
- Google Sheets: This connector received the most votes in the Power BI user forum. Microsoft has not kept its users waiting and the new connector with Google Sheets is now available.
- Delta Sharing: Finally, Power BI has launched a new connector that allows users to connect to any Delta Sharing server.
Updated connectors:
- Google BigQuery: The performance of the Google BigQuery connector is improved by reducing the metadata calls required to load the browser experience. This reduces the loading time of the browser experience.
- Cognite Data Fusion: Previous issues related to customised queries, login to the organisation's account and aggregation of time series when using tags containing special characters have been fixed.
- Dremio Cloud: The connector has been updated to allow users to connect to regions in Dremio Cloud.
5. Chose your workspace
With the new version, once users have created a report's visuals they can choose the workspace where they want to save the report. This increases the capabilities of shared datasets, as users now have the ability to save reports created online in a different workspace from the workspace where the original dataset is located.
6. Permisos a nivel de objetivos
Data governance is a fundamental aspect for organisations when working with Power BI. The platform's data governance options are limited, but have now been extended by the new possibility to set goal level user permissions.
However, data governance remains an unfinished task for the platform. At Bismart we have our own data governance solutions specifically for Power BI: Power BI Viewer and Power BI Analytics.
Discover how to apply data governance measures to Power BI with Power BI Viewer and Power BI Analytics in our webinar series:
These are some of the most recent additions to Power BI. However, you can check out the full list of November 2021 updates here.