We review the 10 most important new features of the latest Power BI update. Check out all the new possibilities and how to enjoy them!
We review the 10 most important new features of the latest Power BI update. A new format pane, optimised functionality, improved usability, new visuals and much more. Discover Power BI's new possibilities and how to unlock them!
Power BI is constantly being updated with new features and technical improvements. As a Microsoft Power BI partner, at Bismart we try to be up to date and inform you about the latest Power BI updates.
This time we take a look at the 10 most important new reporting releases of the last few months.
Top 10 new features of the latest Power BI update - March 2022
1. The latest: Improved backup and restore performance
In August 2021 Microsoft enabled general availability (GA) of backup and restore of large data sets.
This month Microsoft announced performance improvements for both features with a focus on speed. Now backups are completed up to 22 times faster and restore time has been reduced by more than 30%.
Being able to backup and restore datasets faster will enable users to minimise downtime in critical situations and accelerate backup and restore-based migrations of datasets from Azure Analysis Services (AAS) to Power BI.
2. New formatting options for mobile
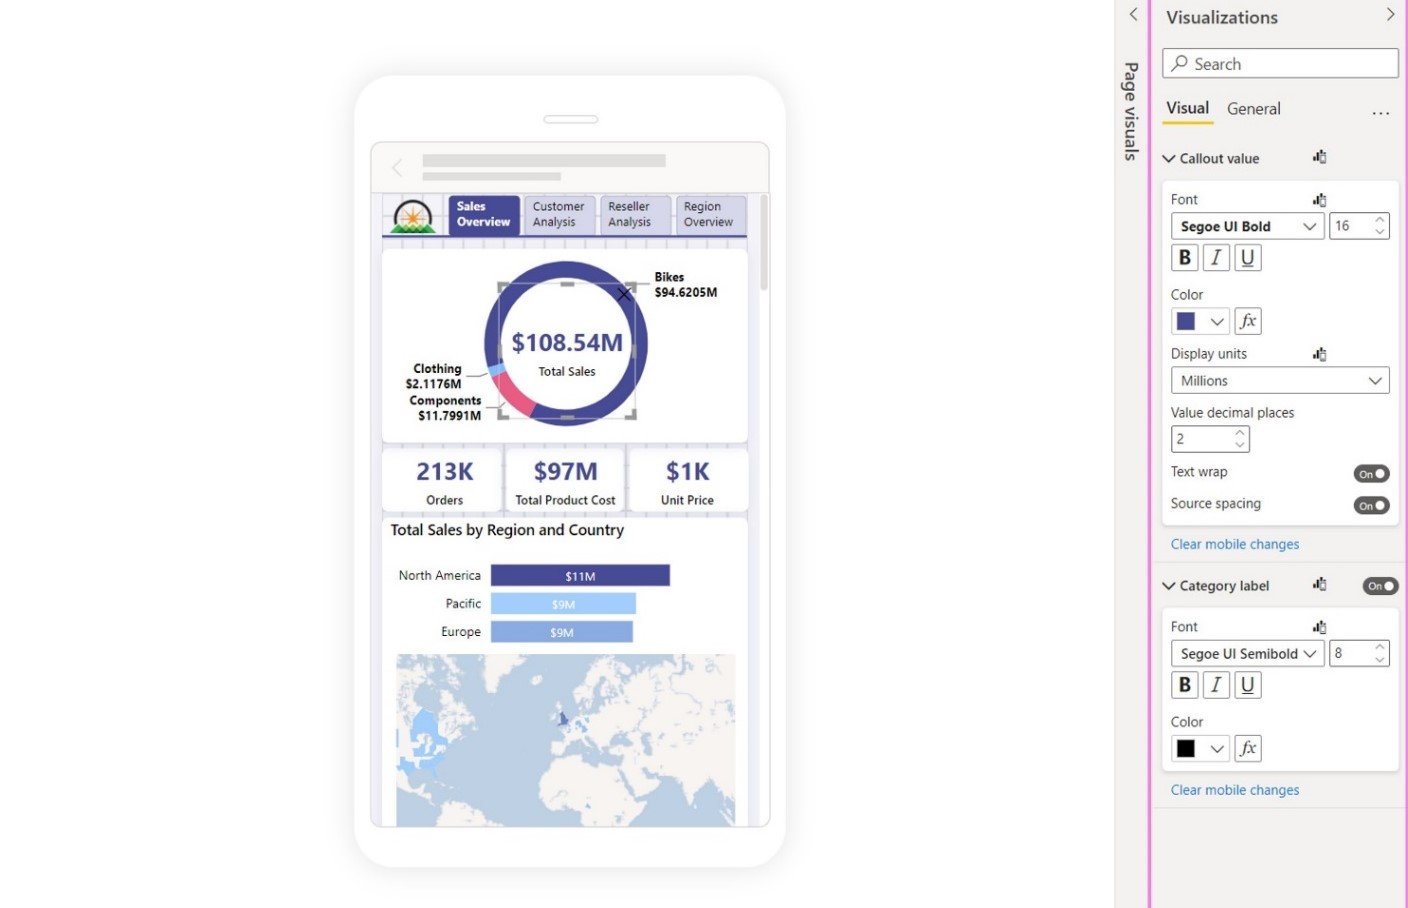
Source: Power BI
The latest Power BI update has focused on the formatting and layout of reports and dashboards on mobile devices. Users will now be able to format visuals directly from the mobile layout and the changes made will only affect the mobile-optimised view.
This new capability enhances the experience of developing dashboards and reports in Power BI Mobile, iimproving data visualisation and storytelling on mobile devices.
For now, this update is only available in Preview. To enjoy it, just have to follow these steps: File > Options and settings > Options > Preview features > Modify visuals settings for mobile layout.
At Bismart we are aware of the importance of design and data visualisation in Power BI, as it democratises data and enables business users to make better data-driven decisions. Because of this, our reporting experts have created an instructional e-book on how to create themes in Power BI. If you are interested in improving your reports' design, you can download it below:
3. Sensitivity labels downstream Inheritance
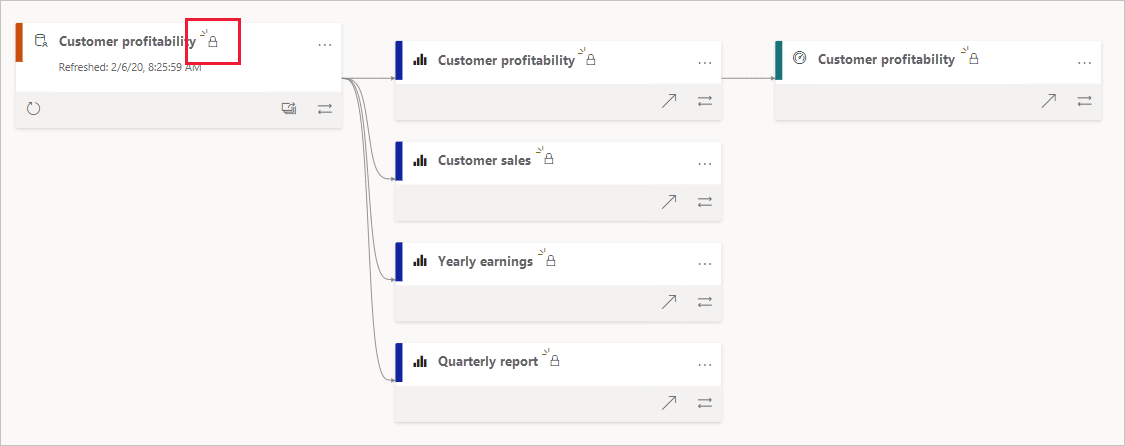
Source: Power BI
Microsoft simplifies the application of sensitivity labels through downstream inheritance. Users will now be able to automatically apply a report's or dataset's sensitivity label across all downstream Power BI dashboards and reports.
From now on —this functionality is already in general availability (GA)— when you apply a sensitivity label to a dataset or Power BI report, the label will be filtered and applied to any content that is built from that dataset or report.
4. Default labels
Default tags, now generally available, allow you to set a reference level of protection that is applied to all Power BI files.
Default tags are applied when creating a new file in Power BI Desktop or a new report or dataset in Power BI Service. Default tags will now be automatically set on the new file or report without interrupting the workflow.
5. Mandatory labels
In addition to the default tags, companies can now also create mandatory tags policies to ensure that Microsoft Information Protection (MIP) sensitivity tags are applied to all new content that is created or uploaded to Power BI.
Thus, when a user saves a PBIX file in Power BI Desktop or an object in Power BI Service without applying a sensitivity tag, the user will be prompted to choose a tag before saving the file. On the other hand, users will not be able to remove tags when a mandatory tag policy has been applied.
This new feature takes us a step closer to data governance.
6. New format pane
The February 2022 Power BI update includes a new look and feel to the format pane that will be automatically activated for all users who install the update. The new format pane aims to optimise usability and consistency across visual and non-visual objects.
The most relevant changes in the format pane are:
-
Outline settings for matrices and tables.
-
Ability to toggle the axis title independent of the axis.
-
Ability to add a shade area to combo charts.
-
Ability to customise marker shape by series in scatter charts.
-
Minor reordering of the field wells the 'Build' pane to match the order of the new format pane's cards for pie charts, donut charts and scatter charts.
Check all the format pane updates here.
7. New visuals
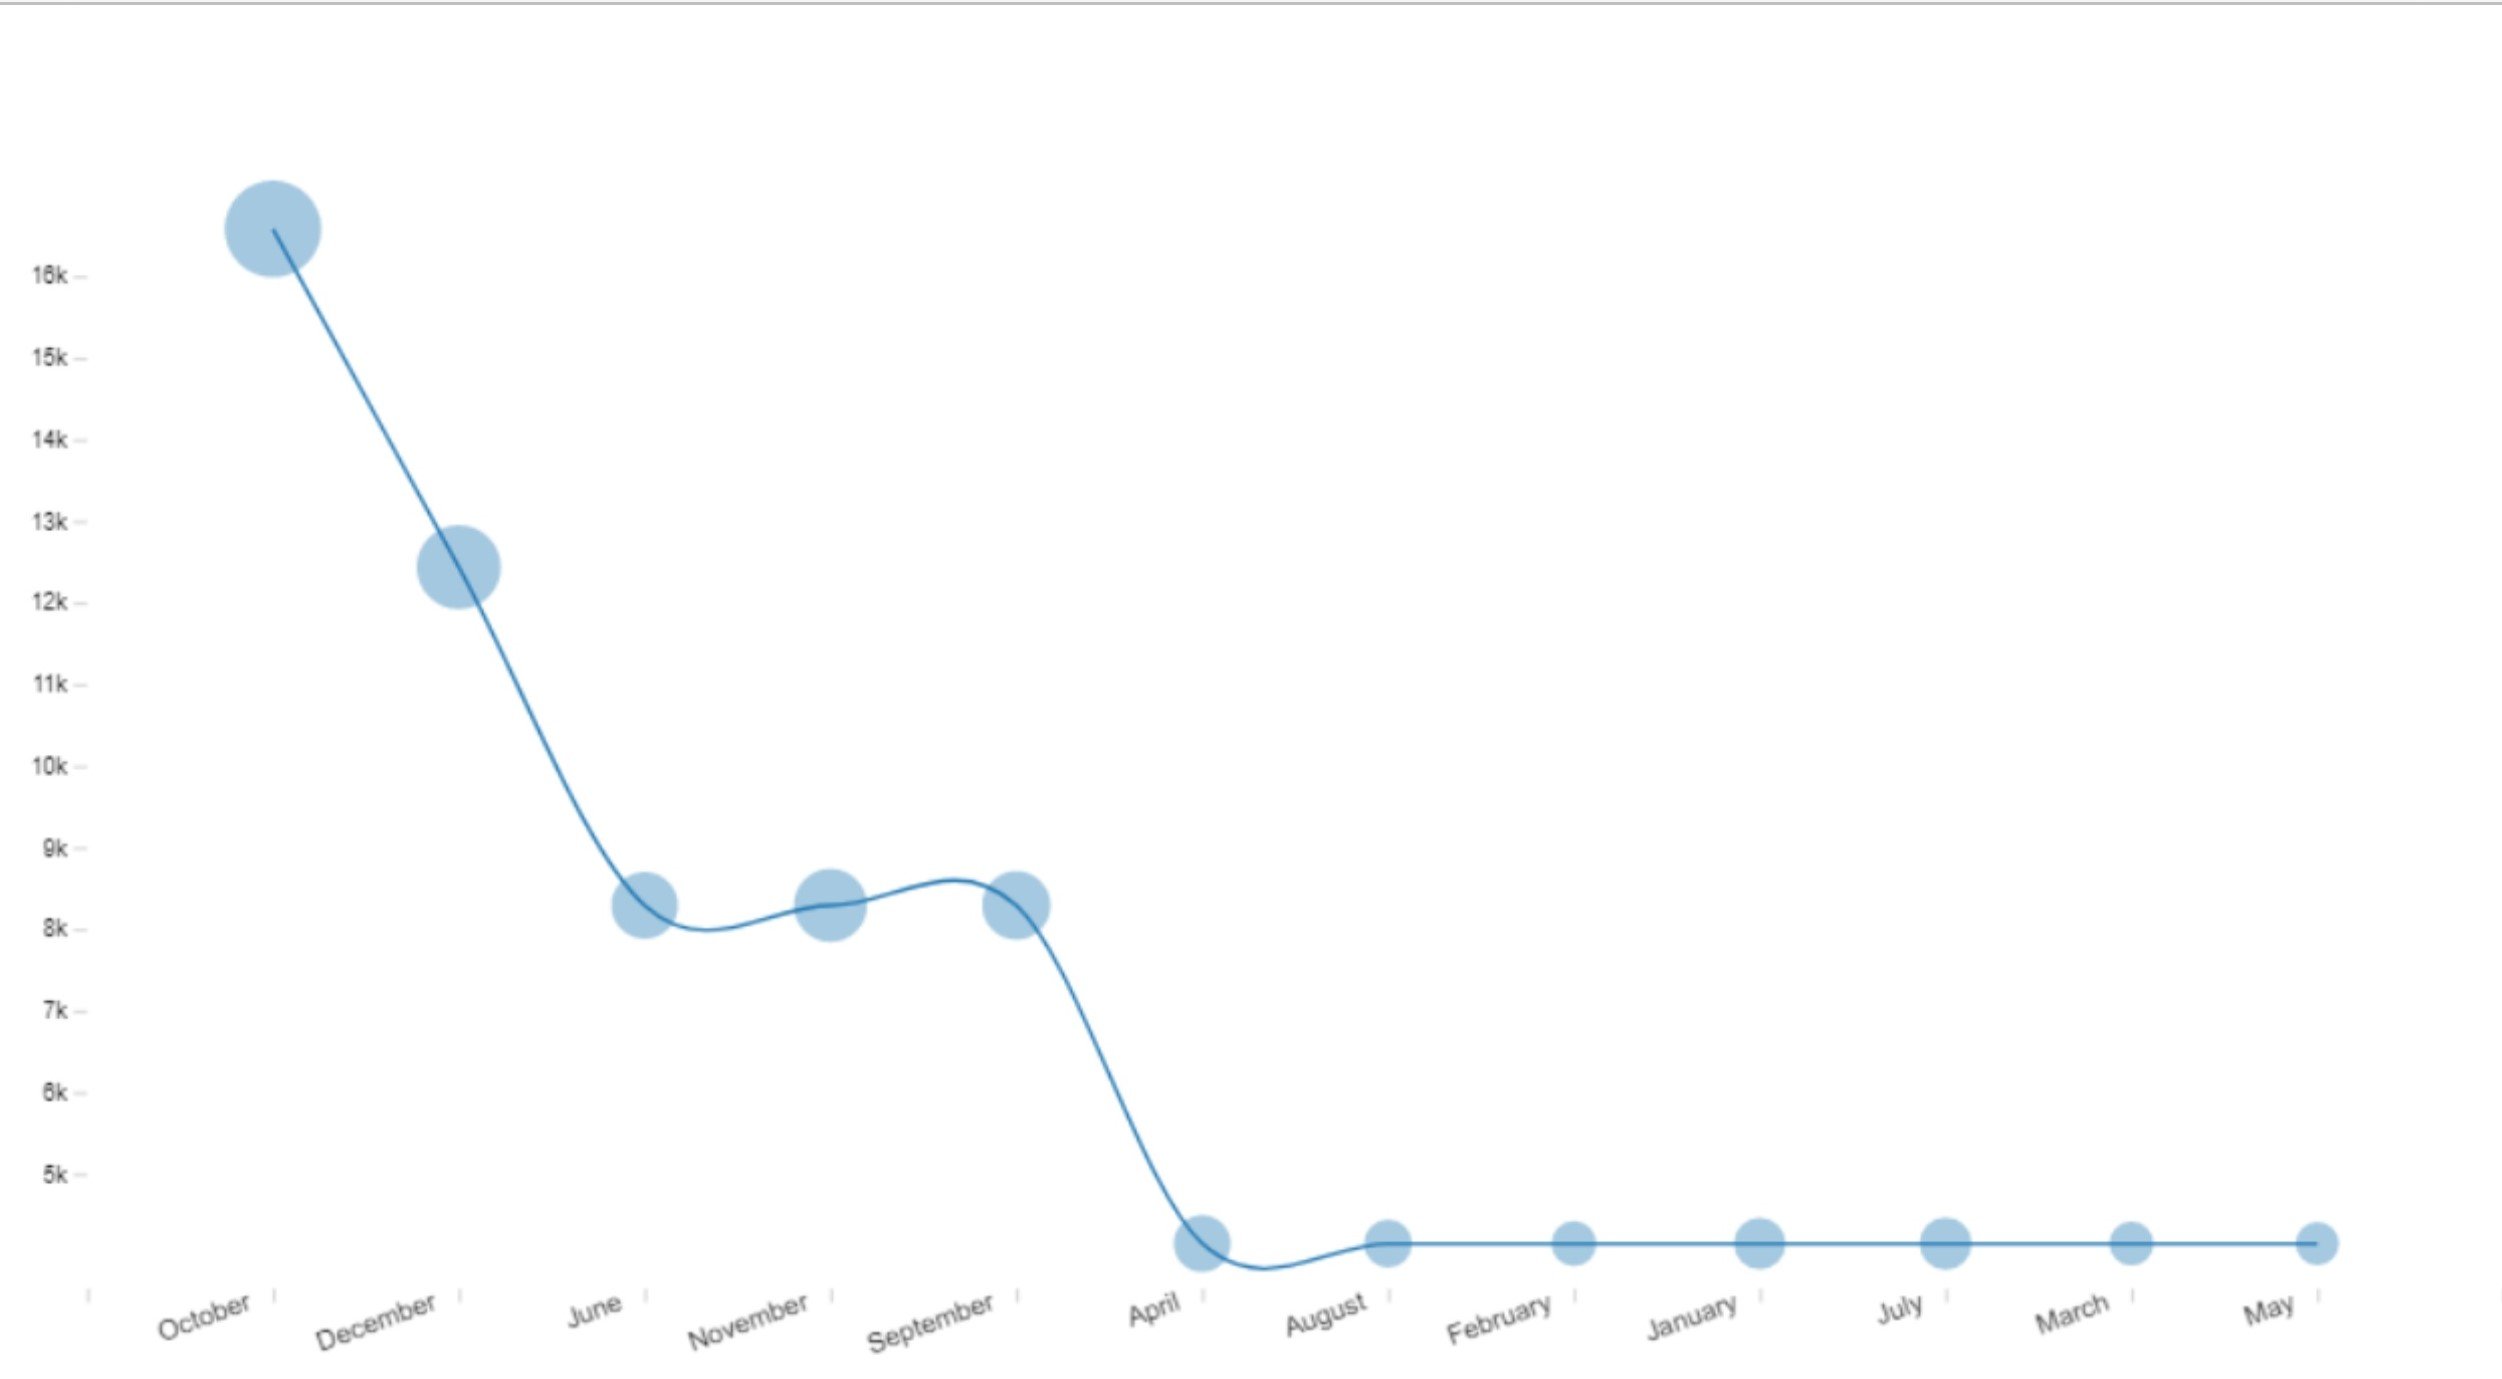
New Power BI Visual: Line with Bubble Chart - Source: Power BI
The latest Power BI update also comes with 12 new Power BI visuals available on Microsoft's AppSource.
The new visuals are:
- Line with Bubble Chart
- Custom tree view with bar chart
- Custom Slicer
- Bar Chart with Top N Selection
- Merged_Bar_Chart
- Clustered Stack Chart
- 100% Stacked Column chart with value label (Not %)
- Bullet_Chart
- Ultimate Upset Plot
- Lollipop Column Visual
- Line Dot Chart
- Overlapped Bar Chart
- Scatter Plot with Line marks (instead of Dots)
- Power ON Visual Planner Service
8. Multi row card selection
From February 2022, users can select more than one row on multi-row cards to filter and highlight the other visuals within a report. Previously, only one row could be filtered.
With this new functionality, unselected rows will be dimmed so that users can easily identify the rows they have filtered. Users can automatically select multiple rows by clicking on Ctrl or Shift. This greatly improves the usability and interactivity of multi-row cards and eases the creation of visual objects.
9. New data sources for Dynamic M Query Parameters
When Power BI launched Dynamic M Query Parameters, the functionality was only compatible with M-based data sources such as Azure Data Explorer, Azure Databricks, BigQuery or Snowflake, among others.
Dynamic M Query Parameters —still in preview— allow users to dynamically set the values of an M Query Parameter via filters or slicers. This functionality optimises the performance of queries without deteriorating the interactivity of the report. To activate the preview: File > Options > Preview features > Select Dynamic M Query Parameters.
With the new update Dynamic M Query Parameters supports new data sources:
- T-SQL based data sources: SQL Server, Azure SQL Database, Synapse SQL pools (such as Azure Synapse Analytics), and Synapse SQL OnDemand pools.
- Oracle
- Teradata
- Dataflows
- SAP Hana Relational
10. New data connectors
Finally, the latest version of Power BI also extends data connectivity possibilities with new data connectors and updates to some existing connectors.
New connectors:
- Amazon OpenSearch Service
- OpenSearch Project
- Digital Construction Works Insights
Updated connectors:
- Azure Databricks: New ability to provide custom SQL queries through Power Query's function 'Databricks.Query'.
- BQE Core: New access to the budgetId field in 'Projects' so that users can check the budget linked to a project.
- MicroStrategy: Added support for OIDC authentication and fixed path detection issue in Power BI online when "/" was not added at the end of MicroStrategy REST API URL.
- Starbust Enterprise: Now, when a catalogue is broken, it is ignored. Before, when one of the catalogues was broken, the whole connection failed.
These are the 10 most important new features of the latest Power BI update. If you have any questions regarding the creation of reports in Power BI, please do not hesitate to contact us. Don't forget to download the e-book: "How to create and customise themes in Power BI?". It's free!