Don't miss the top 10 new features of the latest Power BI Update March 2023. Discover Power BI's new world of possibilities.
Microsoft has just released a new Power BI Update that brings with it some great new features: new buttons, new visual customisation options, new connectors and much more. Don't miss the top 10 new features of the latest Power BI update for March 2023.

If you work with Power BI on a regular basis, you probably know that it is constantly evolving. Microsoft usually extends the functionalities and possibilities of Power BI several times a year, and this March is no exception, with a new update full of new features that improve the possibilities for the creation of reports and dashboards in Power BI.
At Bismart, as a Microsoft Power BI Partner company, we have a team of professional experts in Power BI who keep us informed of all the updates, news and changes in the platform in order to offer the best service to our customers.
- Do you want to stay up to date on all things Power BI? Don't miss our free guide to the 21 best reporting practices for Power BI!
Top 10 highlights of the latest Power BI Update - March 2023
1. New buttons to apply and remove all slicers
We start with a new feature driven by requests from Power BI users, who have long been asking Microsoft to allow report consumers to select slicers and for report visuals to be updated only when they have finished making all slice selections.
Apply all slicers
Microsoft has responded to this request with a new "Apply all slicers" button, which you can now add to Power BI.
How to add the "Apply all slicers" button?
- From the Optimize ribbon > Apply all slicers button
- From the Insert ribbon > Buttons > Apply all slicers
- Or simply choose the Apply all slicers action on any existing button in your report.
Font: Power BI
Users can add as many "Apply all slicers" buttons as they wish in the report. If users prefer to remove or hide the button, the report's slicers will instantly reapply the selections.
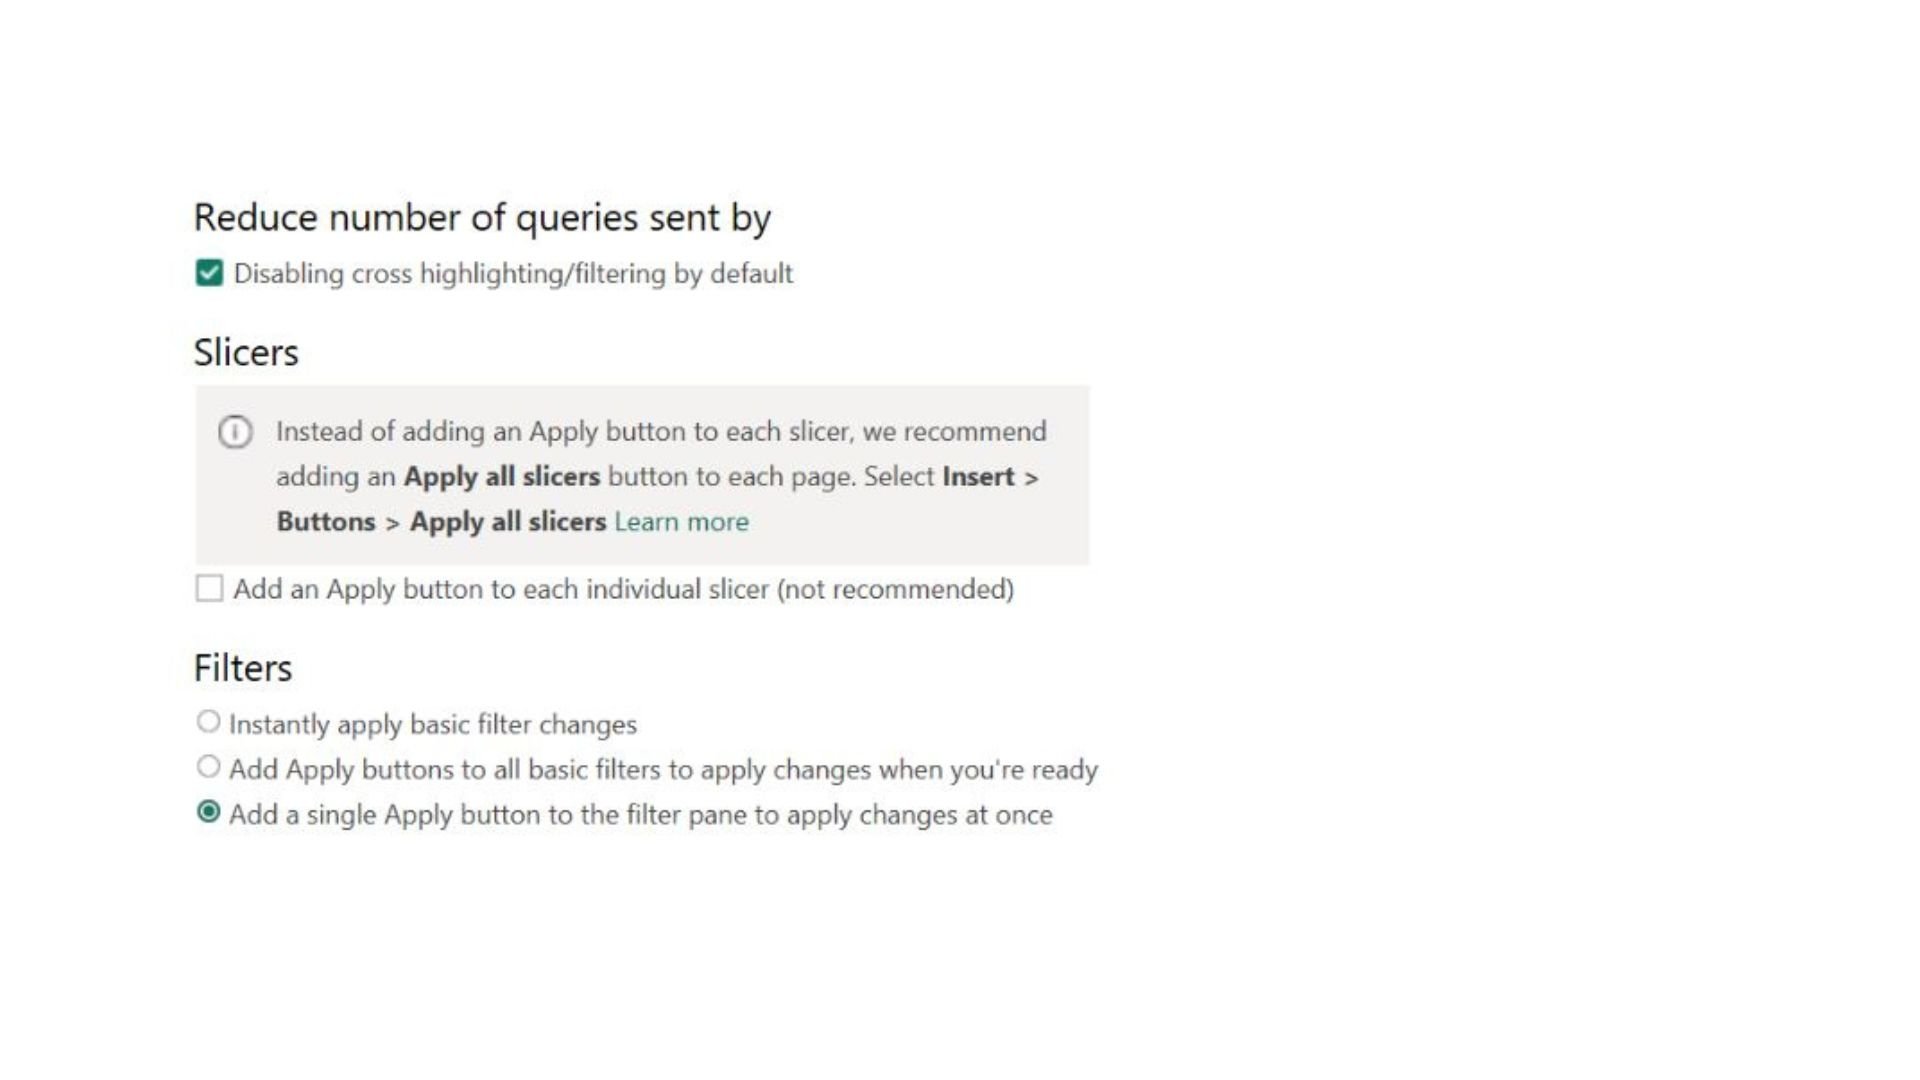
What is the difference between the "Apply all slicers" button and the single apply button for slicers?
The new button is similar to the existing single application button on slicers. Both serve to disable the instant selection of slicers in other visuals until the button is clicked. However, unlike the single "apply button", the "Apply all slicers" button allows users to make selections on multiple slicers and apply them in one click. For this reason, although the single apply button will continue to work in existing reports, Microsoft recommends using the new button instead of the single apply button for filters or slicers.
Clear all slicers
Power BI also includes a new "Clear all slicers" button so that end users of the report can clear all selections in one click.
2. The Format Pane has a new style
Microsoft has decided to change the design of the Format Pane due to complaints from several users. The new Format Pane is a bit darker and shadows have been replaced by borders.
3. On-object: The new way of creating and formatting visuals
On-object is Microsoft's way of improving Power BI's user experience (UX) and to make it easier for users to navigate and create reports and dashboards. According to them, their strategy is to make navigation in Power BI more Office-like.
On-object, now available in preview, allows users to create and format visuals directly from within the visual, without having to move to the Format Pane. Now Power BI creators can modify visuals by right-clicking on the visual, just as with tables or charts in Office applications.
How to turn on On-object preview?
File > Options and settings > Options > Preview Features > On-object interaction
4. New possibilities for customizing visuals
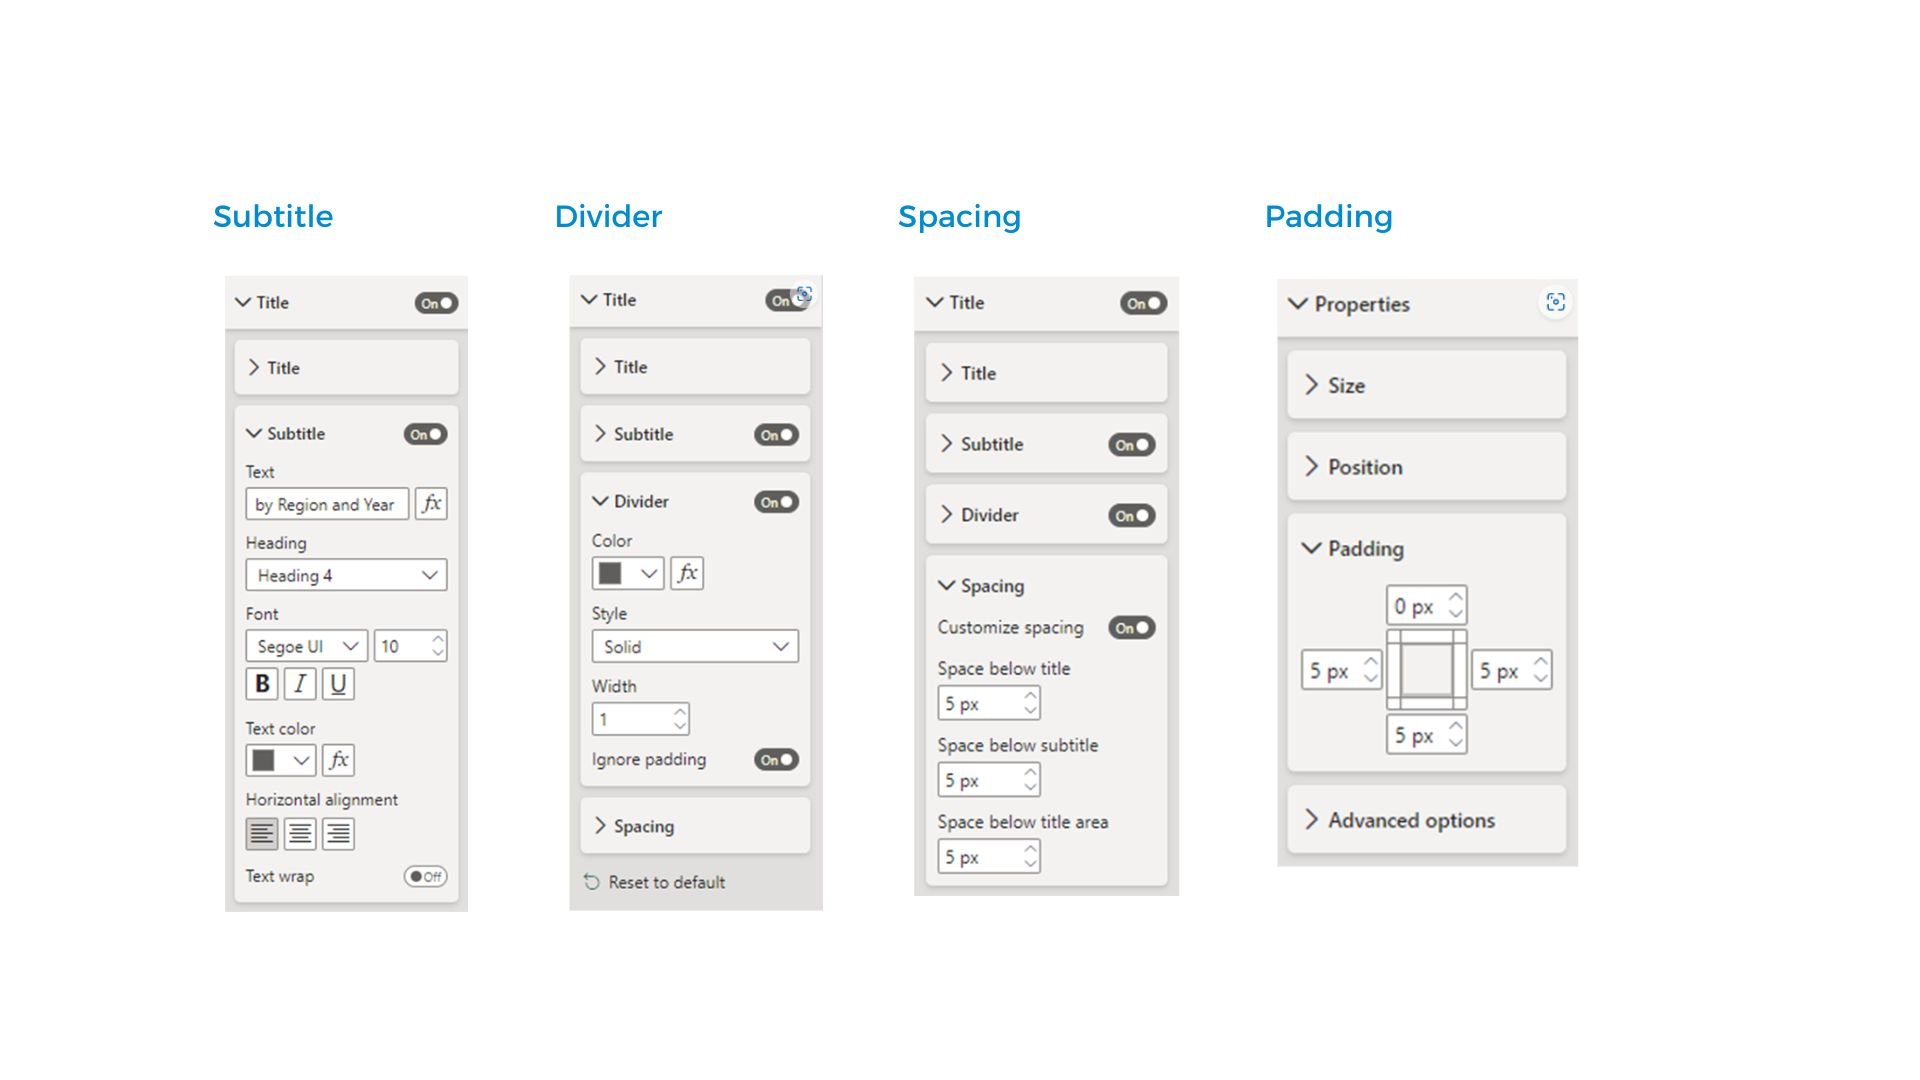
The latest Power BI update includes three new features for customizing Power BI visuals: "Subtitle", "Divider", "Spacing" and "Padding".
Subtitle
Creators can now add a subtitle to the visual to better contextualise their data.
- The new "Subtitle" toggle can be found in the 'Title' settings card of the format pane.
Divider
Divider adds the possibility to add space between the header of the visual and its content.
- The new "Divider" toggle can be found in the 'Title' settings card of the format pane, below the new "Subtitle".
Spacing
On the other hand, users can also control the spacing under each component with the new "Spacing" option, which is located at the bottom of the 'Title' settings card in the format pane.
Padding
Finally, creators can also adjust the margin of the visual's container, increasing the space to make the visuals look more professional and attractive.
- The new "Padding" option can be found on the 'Properties' card of the formatting pane.
5. Connectors Update
Although this Power BI update does not include any new connectors, it does fix and improve many of the existing connectors.
List of updated connectors
- Google BigQuery y Google BigQuery Azure AD: The update contains bug fixes to the Azure Active Directory Single Sign-On scenario.
- Azure Databricks y Databricks: Azure Databricks and Databricks connectors have been updated to fix DAX DAY, MONTH, YEAR queries. The DAX DAY query now works and the DAX MONTH and YEAR queries generate more efficient queries that are passed to Databricks SQLWarehouse. On the other hand, native query performance has also been improved by caching the result of the schema inference query, instead of issuing multiple schema inference queries. Finally, the performance of the native query has been optimised by using the LIMIT 0 query for schema inference.
- Dremio Cloud: Dremio Cloud has removed the Beta label and is now generally available.
- FactSet RMS: The FactSet RMS connector has been updated to include support for contact data stored in IRNs, as well as improvements to the retrieval of custom notes and symbols.
- SurveyMonkey: Version 1.2 of the connector includes performance improvements, minor bug fixes and support for custom variable export, sentiment analysis and tags.
6. General availability of Power BI and Powerpoint integration
In this blog we have previously discussed the new storytelling possibilities offered by the recent integration between Powerpoint and Power BI, which is finally generally available.
7. Multiple Audiences Generally Available
Another great functionality that becomes generally available is the Multiple Audiences feature, which is now compatible with Power BI Mobile.
The ability to include multiple audiences in Power BI apps allows developers to set up multiple user segments in a single app and assign them different permissions per group.
8. New scenarios for 'Scanner API'
The Scanner API, which is part of the Power BI Admin API, allows administrators to efficiently and automatically retrieve valuable information about their organisation's Power BI assets: inventory, metadata and data lineage. In turn, it allows them to leverage this information for their own customised solutions.
The API was developed with the goal of improving the efficiency and performance of Power BI scanning so that it can support large amounts of data assets while meeting organisations' security standards. Ultimately, the Scanner API enables companies to better understand their own business and meet their data governance policies.
The new Power BI update adds new capabilities to the Scanner API:
- Additional artifact metadata: scheduled refresh settings and RDL data source properties.
- Dataset sub-artifact metadata: dataset tables whose 'Enable load' property is set to OFF and RLS configuration.
- Dataset sub-artifact coverage: XMLA changes, automatically generated datasets, datasets created through quick create and quick share, and web modelling modifications.
- Datamarts support.
9. Email subscriptions
This month Power BI also launches email subscriptions for dashboard monitoring. These subscriptions allow users to receive email notifications and stay up to date on their most important dashboards.
How to set up a subscription?
- Select the 'Subscribe' button in the top ribbon > Select 'Add a new subscription' in the panel that opens on the right of the screen.
In the panel you will need to enter your subscription details (name, reason, email details, etc.). You can also choose the frequency at which you wish to receive the emails, as well as set a start date and optionally an end date for the subscription.
After completing and saving the process, you will be able to edit, activate and deactivate, or simply delete the subscription altogether.
10. New custom visuals
The new Power BI update also includes several new custom visuals created by third parties. You can check out the functionality and features of the new visuals by clicking on the link for each of them in the list below:
- Horizontal Bullet Chart with Label
- Banzae BI Dashboard
- Financial Reporting Matrix v7.0
- Acterys Variance
- Feature Summary for Drill Down Combo PRO
- Gantt Chart by MAQ Software (Premium)
From Bismart, we would like to remind you that the original Power BI visuals usually provide better performance than custom visuals.
Before you go...
Of all the new features, which one are you most looking forward to trying? Let us know in the comments.
Also... If you are passionate about Power BI you can't miss our free guide with the 21 best practices for creating reports in Power BI.