Microsoft Power BI is the leader in the latest Gartner's Magic Quadrant for Analytic and Business Intelligence (ABI) Platforms 2023. Find out why.
Gartner has just published a new Gartner Magic Quadrant for Analytics and BI Platforms. For the 16th consecutive year, Microsoft is positioned as a leader in Gartner's Magic Quadrant 2023 for Analytic and Business Intelligence (ABI) thanks to Power BI.
Microsoft Power BI is once again positioned as the leading platform in Gartner's new Magic Quadrant for Analytic and Business Intelligence (ABI) Platforms.
Overall, Gartner names Power BI the best analytic and BI platform on the market for its integration and cohesive vision with Microsoft 365, Teams and Azure Synapse; for its breadth of capabilities; and for its unique competitive price/performance value.
In terms of Power BI's weaknesses, Gartner again refers to Power BI's data governance difficulties. At Bismart, as a preferred Microsoft Power BI partner, we have been working with Power BI for many years and have been trying to address its data governance shortcomings.
We have created a specific data governance solution for Power BI that addresses the shortcomings referred to by Gartner and offers companies the possibility of adapting the Power BI environment to their data governance needs and policies.
What is Gartner's Magic Quadrant and why is it important?
Gartner's Magic Quadrant is a unique graphical representation that evaluates and ranks the world's leading technology vendors. This report is the result of extensive market research conducted by Gartner, a world-renowned consulting firm.
Gartner produces and publishes a Magic Quadrant for each sector of the technology industry, covering more than 100 different categories. This comprehensive and specialised approach makes it a respected authority in the technology and business community, and its findings influence the IT sourcing decisions and sales strategies of companies in the sector.
How it works
Gartner's Magic Quadrant classifies leading technology vendor companies into four distinct categories: Leaders, Visionaries, Niche Players and Challengers. The US consultancy evaluates companies based on two key criteria: their vision and their ability to realise their vision through effective execution.
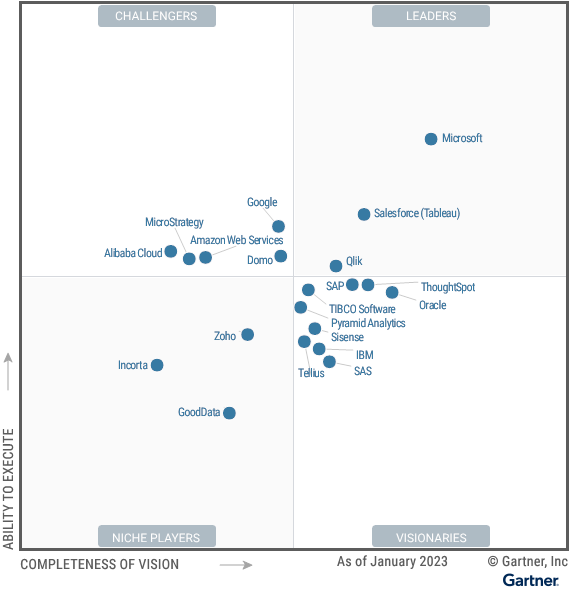
Gartner's Magic Quadrant for Analytic and Business Intelligence Platforms (ABI) 2023
The results of the latest Gartner Magic Quadrant for BI and Analytics Platforms 2023 are clear: Microsoft is the undisputed leader in the quadrant thanks to its flagship analytics and reporting platform, Power BI.
What are analytic and business intelligence platforms (ABI)?
Gartner defines analytic and business intelligence (ABI) platforms as tools that "enable less technical users, including business people, to model, analyze, explore, share and manage data, and collaborate and share findings, enabled by IT and augmented by artificial intelligence (AI)."
In recent years, the focus of the Garnter's Magic Quadrant for Business Intelligence (BI) and Analytics Platforms has been on the ability of tools to provide visual self-service to end users, powered by artificial intelligence for automated insights.
However, Gartner now suggests that ABI platforms must increasingly focus on the needs of analytics content consumers and business decision makers. In other words, this Gartner Magic Quadrant for Analytics and Business Intelligence (ABI) Platforms focuses on the ability of the tools to meet the strategic needs of business users, beyond technical profiles. According to the consultancy, the BI and analytics platform market should focus on the delivery of automated information relevant to the context of business goals and actions, as well as user workflows: "Many platforms are adding capabilities for users to easily compose low-code or no-code automation workflows and applications. This blend of capabilities is helping to expand the vision for analytics beyond simply delivering datasets and presenting dashboards. Today’s ABI platforms can deliver enriched contextualized insights, refocus attention on decision-making processes and ultimately take actions that will deliver business value."
Analytic and business intelligence tools that make up today's market have the ability to transform data into rich, contextualised insights that generate business value so that business users can make data-driven decisions.
On the other hand, Gartner notes that there are other key trends in the ABI market, such as the need to improve data governance in the processes of creating and disseminating analytical content. In addition, companies are demanding open and unrestricted architectures.
Key capabilities of analytic and BI platforms
Gartner's Magic Quadrant for Analytic and Business Intelligence Platforms (ABI) is the result of ranking the tools of 20 different software vendors. For the selection of these 20 players, Gartner bases its selection on 12 critical requirements that all integration platforms as a service must meet.
The critical capabilities of Analytics and Business Intelligence (ABI) Platforms:
1. Automated information: a central attribute of augmented analytics is the ability to apply machine learning techniques to automatically generate information for end users (e.g. by identifying the most important attributes of a dataset).
2. Analytic catalogue: refers to the product's ability to display analytics content for easy search and consumption. The catalogue is searchable and provides recommendations to users.
3. Data preparation: Data preparation includes support for drag-and-drop, user-driven combination of data from different sources, and the creation of analytical models (such as user-defined measures, sets, groups and hierarchies).
4. Data source connectivity: Data source connectivity capabilities allow users to connect to and ingest structured data contained in different types of storage platforms, both on-premises and in the cloud.
5. Data storytelling: Data storytelling is the ability to combine interactive data visualisation with narrative techniques to package and deliver information in a compelling and easy-to-understand way for presentation to decision makers.
6. Data visualisation: Data visualisation enables the creation of highly interactive dashboards and the exploration of data through the manipulation of graphical images. It includes a range of visualisation options that go beyond pie charts, bar charts and line graphs, such as heat and tree maps, geographic maps, scatter plots and other special visual elements.
7. Data governance: Governance functions track usage and manage how information is shared and promoted.
8. Natural Language Query: The Natural Language Query (NLQ) feature allows users to ask questions about data using terms that are typed into a search box or spoken.
9. Reporting: The reporting function provides fully paginated reports that can be scheduled and sent to a wide community of users.
10. Data science integration: Capabilities that enable increased development and prototyping of composable data science and machine learning (DSML) models by citizen data scientists and data scientists with integration into the broader data science and machine learning ecosystem.
11. Metrics store: The ability to provide a virtualised layer that allows users to create and define metrics as code, govern those metrics from data warehouses, and service all downstream analytics, data science and business applications. This also includes capabilities such as target management.
12. Collaboration: Analytic collaboration is the application of collaboration capabilities to analytic workflows for organisations that want to provide an environment in which a broad spectrum of users can simultaneously co-produce an analytic project.
The reasons why Microsoft Power BI is a leader in Gartner's Magic Quadrant for Analytic and BI (ABI) Platforms 2023
As we have already mentioned, Microsoft leads the Gartner Magic Quadrant for Business Intelligence and Analytics Platforms (ABI) thanks to the unique capabilities of Power BI.
This year, Gartner positively highlights Power BI's large market reach and breadth of capabilities thanks to its integration with the other platforms in the Microsoft ecosystem: Microsoft 365, Azure and Teams. On the other hand, Gartner positions Microsoft as a leader for its "flexible pricing, well-above-average functionality, and an ambitious product roadmap."
Strengths
In terms of Microsoft Power BI's strengths, Gartner highlights:
- Alignment with Microsoft 365, Teams and Azure Synapse: The inclusion of Power BI in Microsoft 365 E5 has been a huge channel for spreading the platform. With many customers turning to Teams for remote work collaboration, the ability to access Power BI and now Goals within the same Teams interface is a compelling integration for business users. The alignment of Power BI and Azure Synapse addresses multiple personas and D&A use cases.
- Price/value combination: Power BI service now has a per-user offering to appeal to smaller organisations with 300 employees or less. Larger organisations can still opt for the per-capacity option, which tends to be more profitable with more users. Microsoft does not use a cross-selling strategy to increase revenue per customer, as most ABI platform vendors do.
- Power portfolio and product ambition: Microsoft has a clear vision of cross-utilisation of Power BI, Power Apps and Power Automate to drive business value. Power Apps can be integrated into Power BI dashboards or access Power BI data sets. Power Automate flows can be built to take various actions based on the data. AI-based services, such as text, sentiment and image analysis, are available in Power BI Premium.
Cautions
Regarding Power BI's weakest points, Gartner mentions the following:
- Governance of content creation and publishing: Gartner increasingly receives enquiries from Power BI customers struggling to govern the process of creating and publishing analytics content. Customers express concern about the multiple ways of performing most tasks, such as data modelling or content promotion. For example, data modelling tasks can be performed with datasets, data marts, data streams and Dataverse. Because of its low cost and easy configuration, Power BI deployments tend to proliferate, and standard governance practices are difficult to implement.
- Open architecture and limited headless: While most customers of Power BI services appreciate the tight integration of Microsoft's architecture, there is a growing demand for greater interoperability between competing BI platforms. In particular, as an analytics catalogue and metrics warehouse, many Power BI customers would like to see more open integration with competing products.
- Azure as the only deployment option: Microsoft does not give customers the flexibility to choose a cloud IaaS offering. While data connectivity enables multi-cloud and hybrid cloud scenarios, its Power BI service only runs on Azure. However, customers using Azure can take advantage of the global reach and multi-geographic capabilities offered by Microsoft's cloud platform.
As a Microsoft Gold Partner since our foundation, at Bismart we are very pleased that Gartner confirms once again that we work with the best integration tools and ecosystems on the market. This confirmation allows us to ensure that we develop our business solutions with the latest technology and that we are offering the best capabilities and guarantees in the market to our customers.
- Would you like to enhance the data governance capabilities of Power BI? Discover Power BI Viewer!