We explore the 6 key steps in carrying out a data analysis process through examples and a comprehensive guide.
Despite being a science very much linked to technology, data analysis is still a science. Like any science, a data analysis process involves a rigorous and sequential procedure based on a series of steps that cannot be ignored. Discover the essential steps of a data analysis process through examples and a comprehensive guide.

Often, when we talk about data analysis, we focus on the tools and technological knowledge associated with this scientific field which, although fundamental, are subordinate to the methodology of the data analysis process.
In this article we focus on the 6 essential steps of a data analysis process with examples and addressing the core points of the process' methodology: how to establish the objectives of the analysis, how to collect the data and how to perform the analysis. Each of the steps listed in this publication requires different expertise and knowledge. However, understanding the entire process is crucial to drawing meaningful conclusions.
-
Don't miss: The Role of Data Analytics in Business
On the other hand, it is important to note that an enterprise data analytics process depends on the maturity of the company's data strategy. Companies with a more developed data-driven culture will be able to conduct deeper, more complex and more efficient data analysis.
If you are interested in improving your corporate data strategy or in discovering how to design an efficient data strategy, we encourage you to download the e-book: "How to create a data strategy to leverage the business value of data".
The 6 steps of a data analysis process in business
Step 1 of the data analysis process: Define a specific objective

The initial phase of any data analysis process is to define the specific objective of the analysis. That is, to establish what we want to achieve with the analysis. In the case of a business data analysis, our specific objective will be linked to a business goal and, as a consequence, to a performance indicator or KPI.
To define your objective effectively, you can formulate a hypothesis and define an evaluation strategy to test it. However, this step should always start from a crucial question:
-
What business objective do I want to achieve?
or:
-
What business challenge am I trying to address?
While this process may seem simple, it is often more complicated than it first appears. For a data analytics process to be efficient, it is essential that the data analyst has a thorough understanding of the company's operations and business objectives.
Once the objective or problem we want to solve has been defined, the next step is to identify the data and data sources we need to achieve it. Again, this is where the business vision of the data analyst comes into play. Identifying the data sources that will provide the information to answer the question posed involves extensive knowledge of the business and its activity.
Bismart Tip: How to set the right objective?
Setting the objective of an analysis depends, in part, on our creative problem-solving skills and our level of knowledge about the field under study. However, in the case of a business data analysis, it is most effective to pay attention to established performance indicators and business metrics about the field of study we want to solve. Exploring the company's activity reports and dashboards will provide valuable information about the organisation's areas of interest.
Step 2 of the data analysis process: Data collection

Once the objective has been defined, it is time to design a plan to obtain and consolidate the necessary data. At this point it is essential to identify the specific types of data you need, which can be quantitative (numerical data such as sales figures) or qualitative (descriptive data such as customer feedback).
On the other hand, you should also consider the typology of data in terms of the data source, which can be classified as: first-party data, second-party data and third-party data.
First-party data:
First-party data is the information that you or your organisation collects directly. It typically includes transactional tracking data or information obtained from your company's customer relationship management system, whether it is a CRM or a Customer Data Platform (CDP).
Regardless of its source, first-party data is usually presented in a structured and well-organised way. Other sources of first-party data may include customer satisfaction surveys, feedback from focus groups, interviews or observational data.
Second-party data:
Second-party data is information that other organisations have directly collected. It can be understood as first-party data that has been collected for a different purpose than your analysis.
The main advantage of second-party data is that it is usually organised in a structured way. That is, it often is structured data that will make your work easier. It also tends to have a high degree of reliability. Examples of second-hand data include website, apps or social media activity, as well as online purchase or shipping data.
Third-party data:
Third-party data is information collected and consolidated from various sources by an external entity. Third-party data often comprises a wide range of unstructured data points. Many organisations collect data from third parties to generate industry reports or conduct a market research.
A specific example of third-party data collection is provided by the consultancy Gartner, which collects and distributes data of high business value to other companies.
Step 3 of the data analysis process: Data cleaning

Once we have collected the data we need, we need to prepare it for analysis. This involves a process known as data cleaning or consolidation, which is essential to ensure that the data we are working with is of quality.
The most common tasks in this part of the process are:
-
Eliminating significant errors, duplicated data and inconsistencies, which are inherent issues when aggregating data from different sources.
-
Getting rid of irrelevant data, i.e. extracting observations that are not relevant to the intended analysis.
-
Organising and structuring the data: performing general "cleaning" tasks, such as rectifying typographical errors or layout discrepancies, to facilitate data mapping and manipulation.
-
Fixing important gaps in the data: during the cleaning process, important missing data may be identified and should be remedied as soon as possible.
It is important to understand that this is the most time-consuming part of the process. In fact, it is estimated that a data analyst typically spends around 70-90% of their time cleaning data.
If you are interested in learning more about the specific steps involved in this part of the process, you can read our post on data processing.
Bismart Tip: Resources to speed up data cleansing
Manually cleaning datasets can be a very time consuming task. Fortunately, there are several tools available to simplify this process. Open source tools such as OpenRefine are excellent options for basic data cleansing and even offer advanced scanning functions. However, free tools can have limitations when dealing with very large datasets. For more robust data cleaning, Python libraries such as Pandas and certain R packages are more suitable. Fluency in these programming languages is essential for their effective use.
Step 4 of the data analysis process: Data analysis

Once the data has been cleaned and prepared, it is time to dive into the most exciting phase of the process, data analysis.
At this point, we should bear in mind that there are different types of data analysis and that the type of data analysis we choose will depend, to a large extent, on the objective of our analysis. On the other hand, there are also multiple techniques to carry out data analysis. Some of the best known are univariate or bivariate analysis, time series analysis and regression analysis.
In a broader context, all forms of data analysis fall into one of the following four categories.
Types of data analysis
Descriptive analysis
Descriptive analysis is a type of analysis that explores past events. It is the first step that companies usually take before going into more in-depth investigations.
Diagnostic analysis
Diagnostic analysis revolves around unravelling the "why" of something. In other words, the objective of this type of analysis is to discover the causes or reasons for an event of interest to the company.
Predictive analytics
The focus of predictive analytics is to forecast future trends based on historical data. In business, predictive analytics is becoming increasingly relevant.
Unlike the other types of analysis, predictive analytics is linked to artificial intelligence and, typically, to machine learning and deep learning. Recent advances in machine learning have significantly improved the accuracy of predictive analytics and it is now one of the most valued types of analysis by companies.
Predictive analytics enables a company's senior management to take high-value actions such as solving problems before they happen, anticipating future market trends or taking strategic actions ahead of the competition.
Prescriptive analysis
Prescriptive analysis is an evolution of the three types of analysis mentioned so far. It is a methodology that combines descriptive, diagnostic and predictive analytics to formulate recommendations for the future. In other words, it goes one step further than predictive analytics. Rather than simply explaining what will happen in the future, it offers the most appropriate courses of action based on what will happen. In business, prescriptive analytics can be very useful in determining new product projects or investment areas by aggregating information from other types of analytics.
An example of prescriptive analytics is the algorithms that guide Google's self-driving cars. These algorithms make a multitude of real-time decisions based on historical and current data, ensuring a safe and smooth journey.
Step 5 of the data analysis process: Transforming results into reports or dashboards
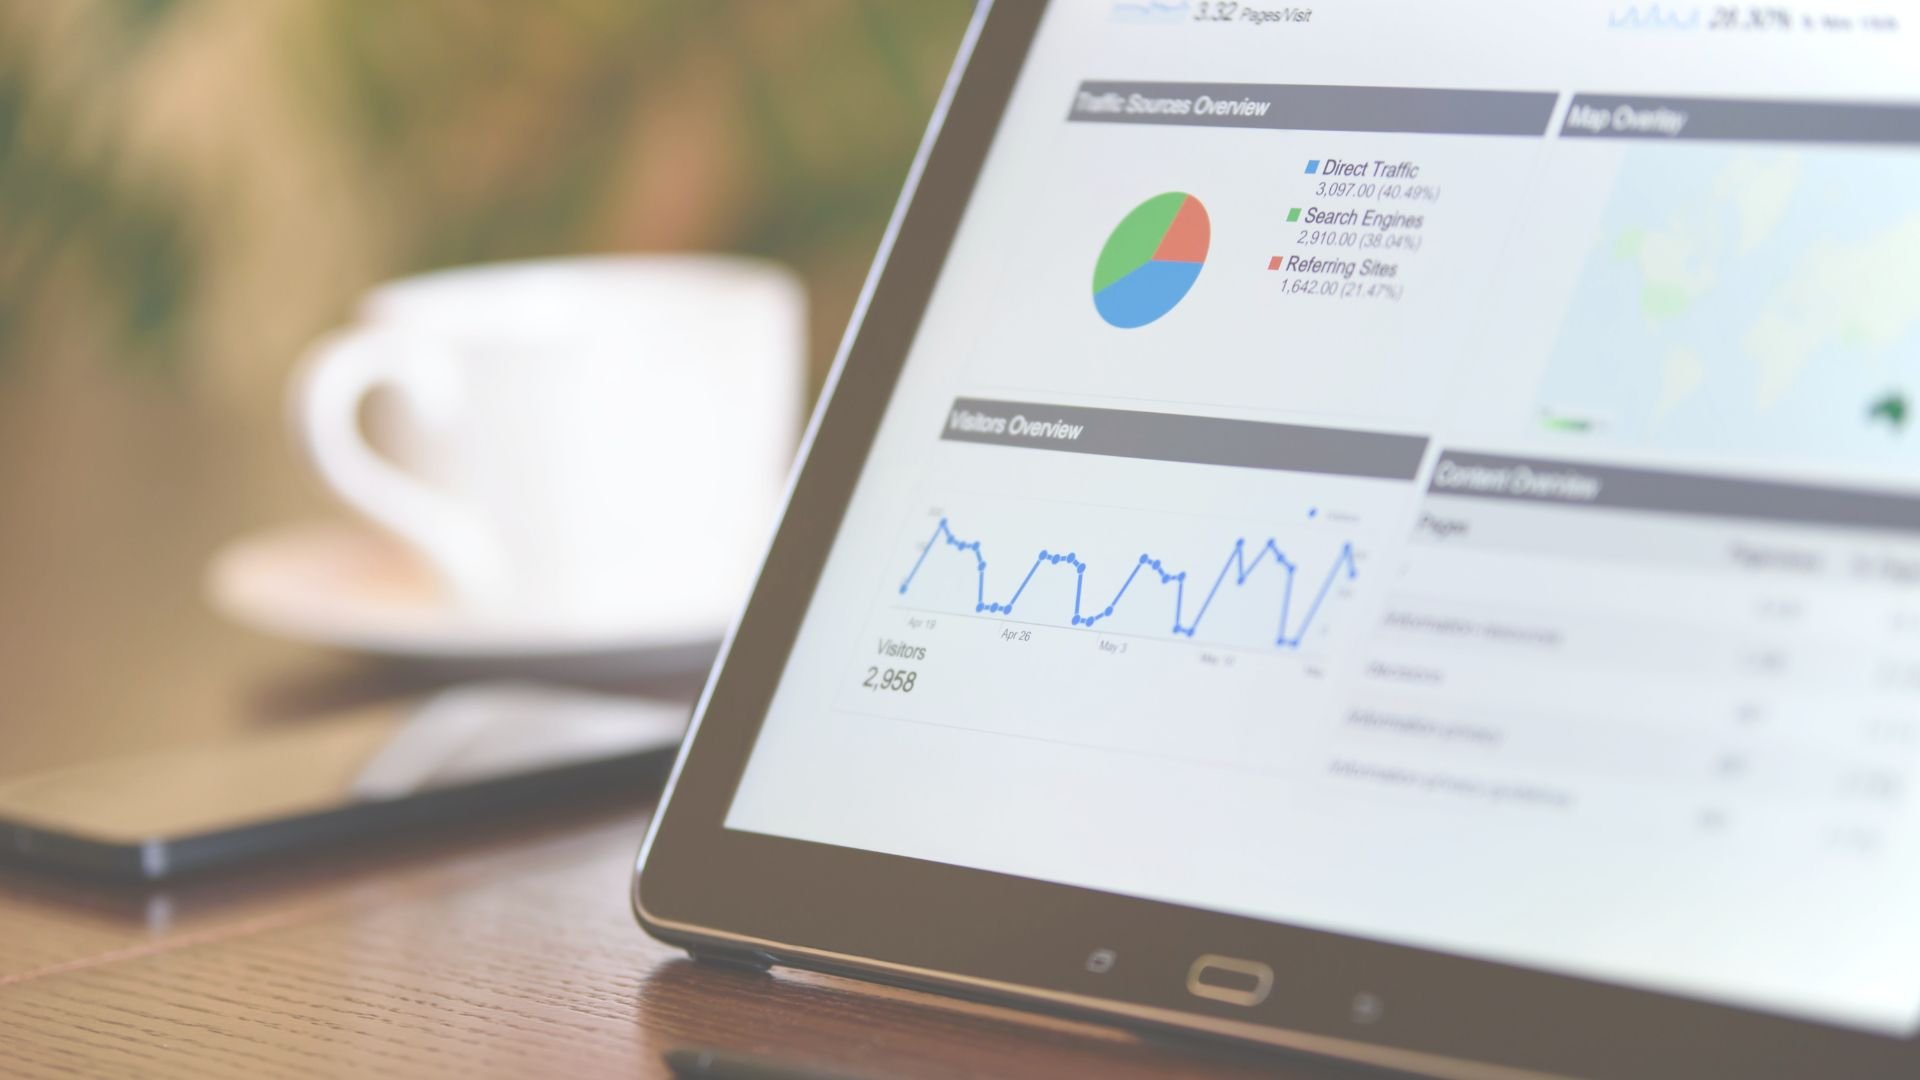
Once the analysis is complete and conclusions have been drawn, the final stage of the data analysis process is to share these findings with a wider audience. In the case of a business data analysis, to the organisation's stakeholders.
This step requires interpreting the results and presenting them in an easily understandable way so that senior management can make data-driven decisions. It is therefore essential to convey clear, concise and unambiguous ideas. Data visualisation plays a key role in achieving this and data analysts frequently use reporting tools such as Power BI to transform data into interactive reports and dashboards to support their conclusions.
The interpretation and presentation of results significantly influences the trajectory of a company. In this regard, it is essential to provide a complete, clear and concise overview that demonstrates a scientific and fact-based methodology for the conclusions drawn. On the other hand, it is also critical to be honest and transparent and to share with stakeholders any doubts or unclear conclusions you may have about the analysis and its results.
The best data visualisation and reporting tools
If you want to delve deeper into this part of the data analysis process, don't miss our post on the best business intelligence tools.
However, we anticipate that Power BI has been proclaimed the leading BI and analytics platform in the market in 2023 by Gartner.
At Bismart, as a Microsoft Power BI partner, we have a large team of Power BI experts and, in addition, we also have our set of specific solutions to improve the productivity and performance of Power BI.
Recently, we have created an e-book in which we explore the keys for a company to develop an efficient self-service BI strategy with Power BI. Don't miss it!
Step 6 of the data analysis process: Transforming insights into actions and business opportunities

The final stage of a data analysis process involves turning the intelligence obtained into actions and business opportunities.
On the other hand, it is essential to be aware that a data analysis process is not a linear process, but rather a complex process full of ramifications. For example, during the data cleansing phase, you may identify patterns that raise new questions, leading you back to the first step of redefining your objectives. Similarly, an exploratory analysis may uncover a set of data that you had not previously considered. You may also discover that the results of your central analysis seem misleading or incorrect, perhaps due to inaccuracies in the data or human error earlier in the process.
Although these obstacles may seem like setbacks, it is essential not to become discouraged. Data analysis is intricate and setbacks are a natural part of the process.
Conclusion
In this article, we have delved into the key stages of a data analysis process, which, in brief, are as follows:
-
Defining the objective: Define the business challenge we intend to address. Formulating it as a question provides a structured approach to finding a clear solution.
-
Collect the data: Developing a strategy for gathering the data needed to answer our question and identifying the data sources most likely to have the information we need.
-
Clean the data: Drill down into the data, cleaning, organising and structuring it as necessary.
-
Analyse the data using one of four main types of data analysis: descriptive, diagnostic, predictive and prescriptive.
-
Disseminate findings: Choose the most effective means to disseminate our insights in a way that is clear, concise and encourages intelligent decision-making.
-
Learning from setbacks: Recognising and learning from mistakes is part of the journey. Challenges that arise during the process are learning opportunities that can also transform our analysis process into a more effective strategy.
Before you go...
Companies with a well-defined and efficient data strategy are much more likely to obtain truly useful business intelligence.
We encourage you to explore in more depth the steps to take to consolidate an enterprise data strategy through our e-book "How to create a data strategy":
