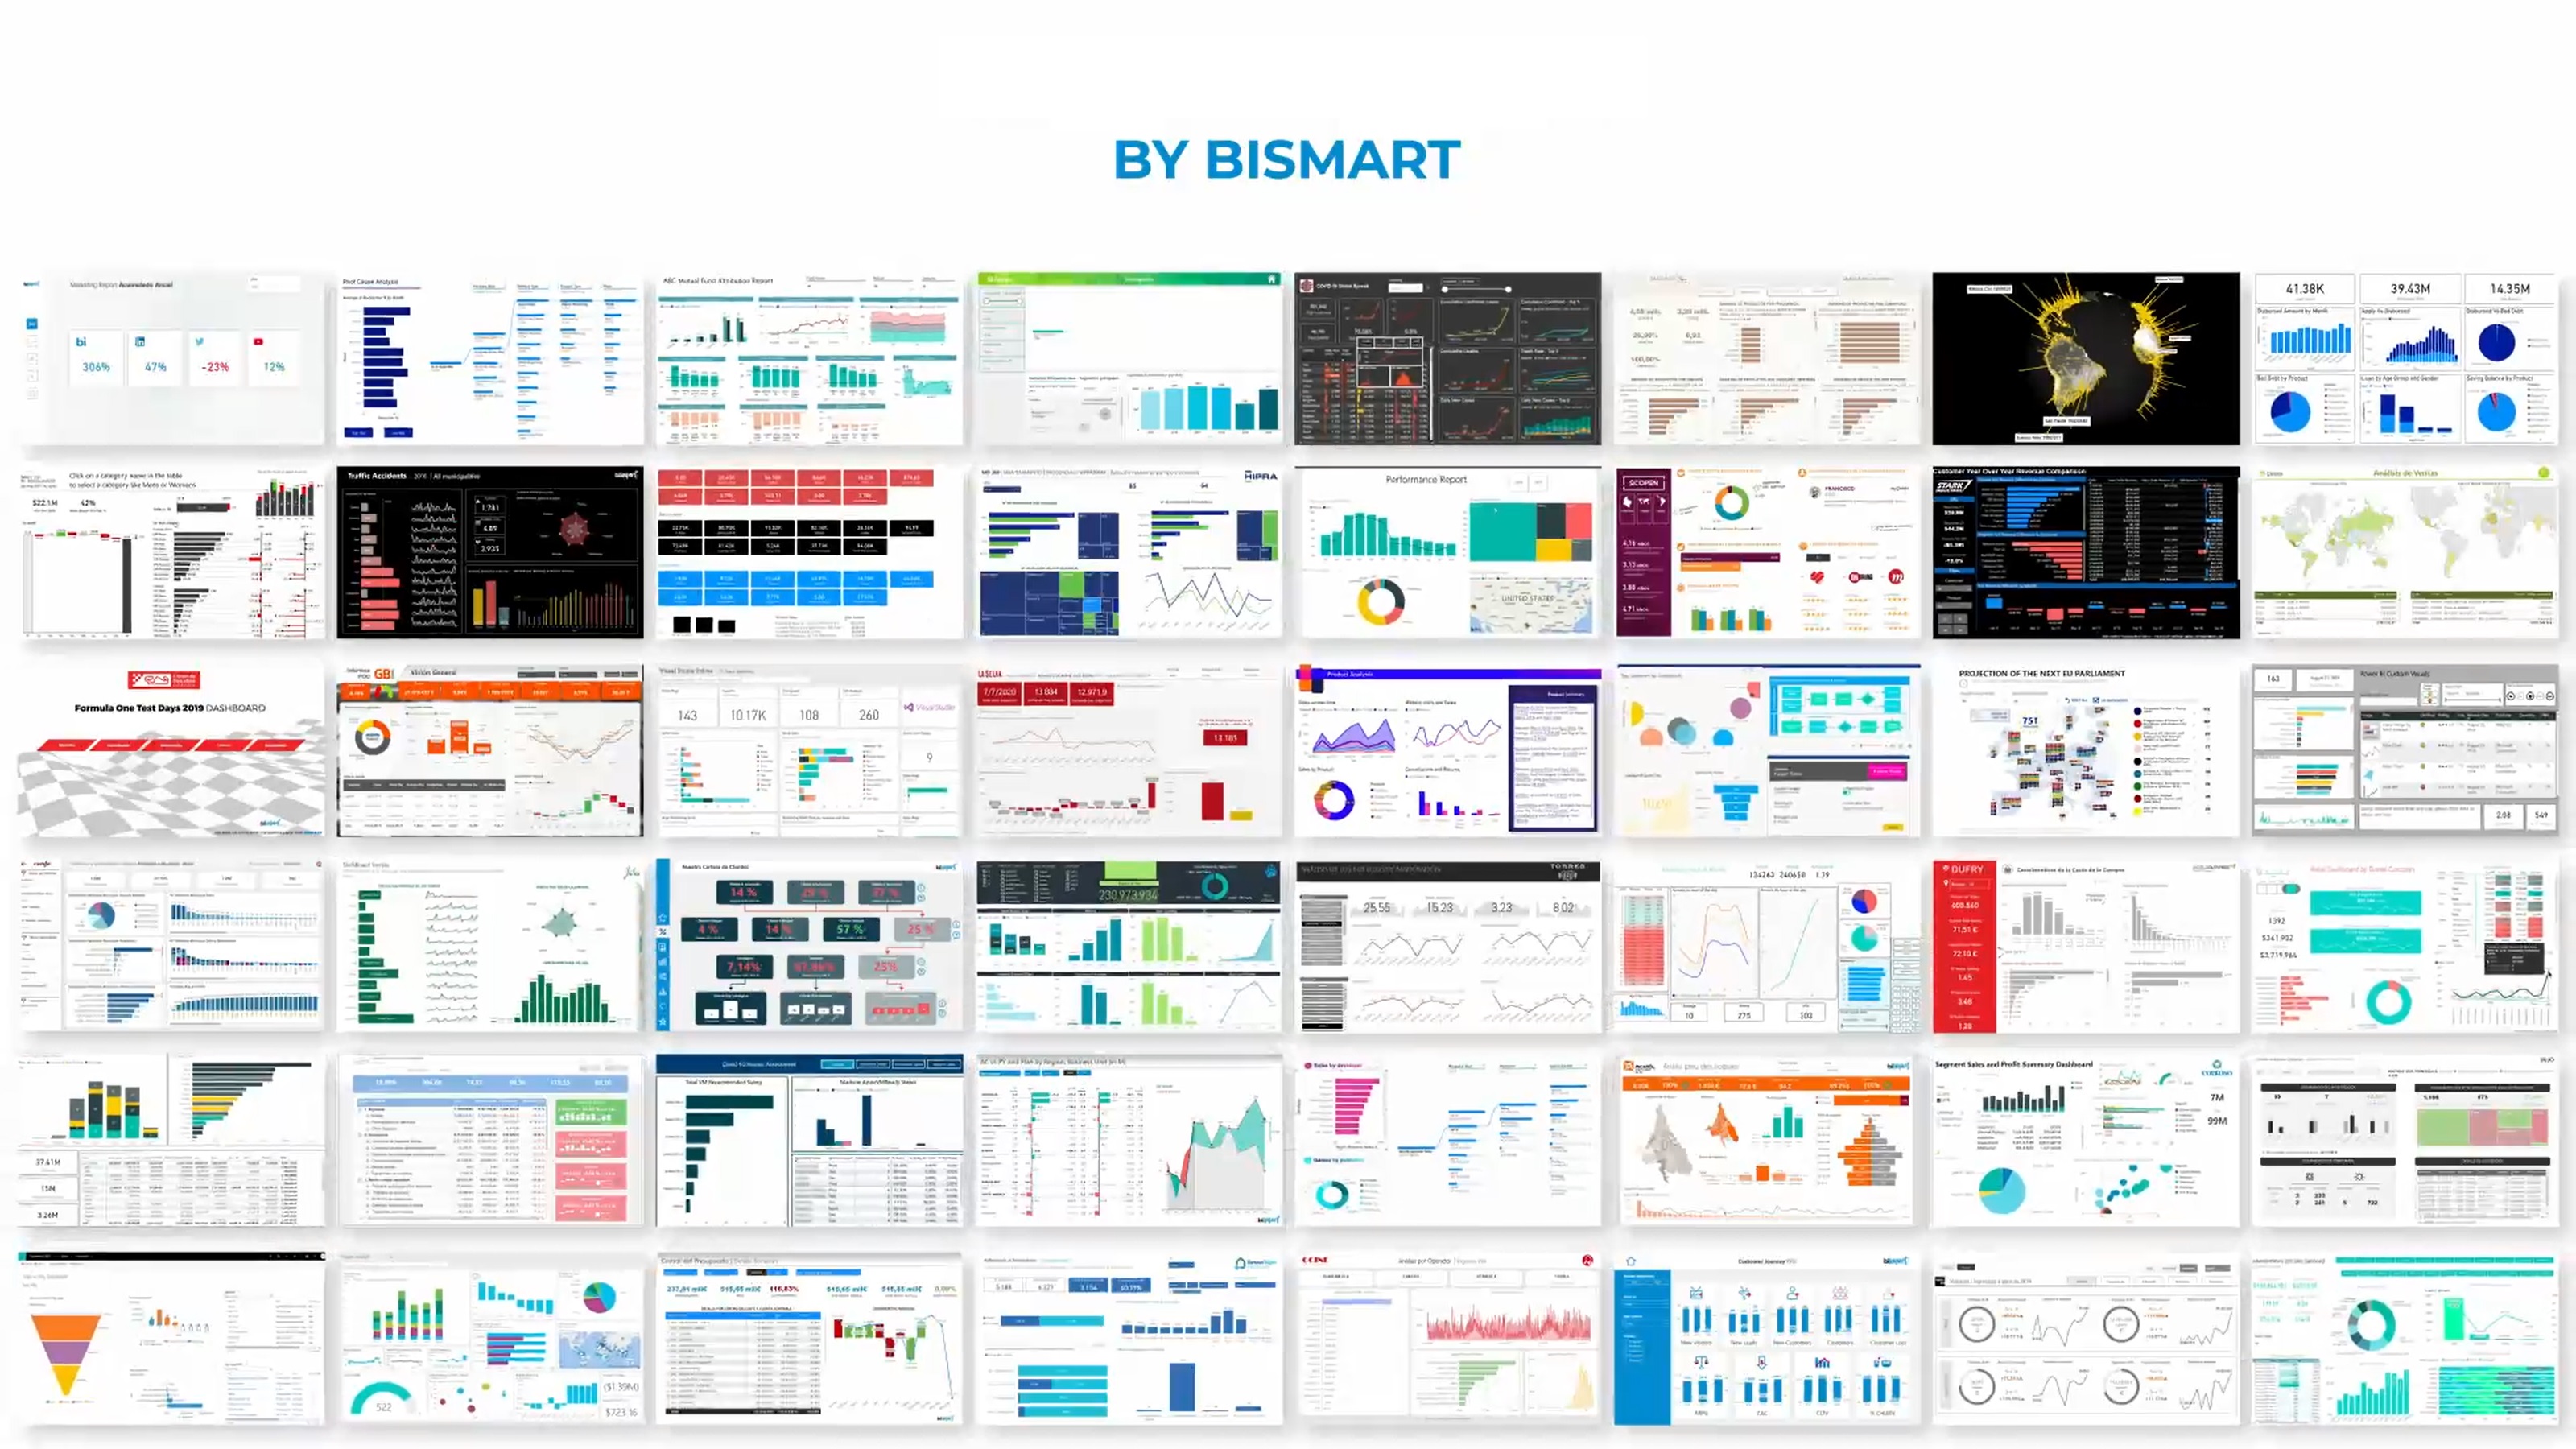
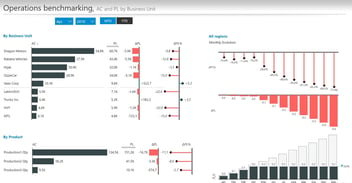
Discover the 15 essential Power BI dashboards for 2025. Improve business decisions with real-time KPIs. Download the free visual guide now.
Do you know what the companies leading their industries in 2025 have in common ? They all make data-driven decisions. In a context where time, accuracy and efficiency are key, dashboards have become essential allies for managers who want to anticipate changes, optimize resources and improve results.
In this article you will discover which are the 15 most important business dashboards of the moment, what KPIs they include and how they can transform the way your organization operates and decides.
From finance and sales to marketing, HR or strategy, each dashboard plays a key role on the road to a more agile, profitable and data-driven enterprise.
📘 Want to see real examples of these dashboards?
Download the free guide with the 15 must-have dashboards for 2025
Discover the best Power BI Dashboards of 2025 in this free guide.
Why Are Dashboards Essential for Modern Companies?
In an increasingly competitive and digitized business environment, the ability to make informed decisions in real time has become a critical success factor.
In this context, dashboards are key tools that enable organizations to visualize their most relevant data in a clear, interactive and centralized way.
A business dashboard is a graphical representation of the KPIs (Key Performance Indicators) andkey metrics that reflect the performance of a company in its different areas. With the right dashboards, business managers can detect deviations, identify opportunities andanticipate changes.
For example, a finance team can detect a cost anomaly before it impacts margin. Or a marketing manager can adjust an ongoing campaign if he sees a low conversion in real time. Without dashboards, these decisions would come late.
In 2025, leading companies share a common characteristic: their decision making is data-driven. And dashboards are the cornerstone of that transformation to a data-driven culture.
Benefits of Implementing Dashboards in Business
- Global and real-time vision of the business.
- Greater agility to make strategic decisions.
- Quick detection of deviations and problems.
- Encouragement of transparency and alignment between departments.
- Automation of reporting and time savings.
- Continuous improvement based on objective data.
- Anticipation of future scenarios through predictive analysis.
The 15 Must-Have Power BI Dashboards for Companies in 2025
Explore the 15 dashboards with real examples
Discover the must-have Power BI Dashboards of 2025 in this free guide.
Balanced Scorecard (BSC)
The Balanced Scorecard enables organizations to assess their performance from a holistic perspective, aligning strategic goals with operational outcomes. It is especially valuable for understanding the broader impact of business initiatives—not just financially, but also across key dimensions such as customer satisfaction, internal processes, and innovation.
 Key indicators:
- Profitability and ROI
- Customer satisfaction
- Efficiency of internal processes
- Training and innovation
Benefit: provides a complete and balanced view of the business, aligning operational metrics with strategic objectives.
➡️ For more information, see the Guide to Evaluating a Company's Performance and Strategic Plan.
2. Financial Dashboard
This type of dashboard facilitates full control of the company's financial health, allowing accurate tracking of financial performance in real time.
It is essential for anticipating budget deviations, detecting financial bottlenecks and supporting strategic decision-making from the accounting or financial area.

Key indicators:
- Revenues and expenses by cost center
- EBITDA, operating cash flow
- Budget comparison
- Solvency and profitability ratios
➡️ Don't miss our CFO's Guide: The CFO of the Future
3. Sales Dashboard
With this dashboard you can visualize the performance of the sales team from multiple angles: by region, product, channel or sales manager. It allows you to identify which lines of business are most profitable, which channels are underperforming and how sales are performing against targets.
Key indicators:
- Sales volume and conversion rate.
- Sales by channel or territory
- Average sales cycle
- Target vs. result
➡️ More information in the Guide: How to Drive Profit from Sales
4. Marketing Dashboard
This dashboard allows you to measure the effectiveness of campaigns, analyze the behavior of leads throughout the funnel and know the return on advertising investment.
It provides an integrated view of all channels and facilitates decisions based on real engagement and conversion data.

Key indicators:
- Cost per lead (CPL) and CAC
- Campaign ROI
- Interactions per channel
- Landing page traffic and conversions
Practical application: Redirect investment to the most profitable channels and optimize content according to audience behavior.
5. Cost Optimization Dashboard
Helps to understand the cost structure in detail, identifying areas where efficiency can be improved without compromising quality. Allows you to evaluate the return on savings initiatives and monitor spending per unit produced or per project.

Key indicators:
- Fixed and variable costs.
- Cost per unit or service
- Savings per action implemented
- Monthly evolution of expenditure
Benefit: Maximizes operational profitability by reducing unnecessary costs and prioritizing efficient investments.
6. Customer Segmentation Dashboard
This customer segmentation dashboard classifies customers into strategic segments based on their behavior, economic value or type of relationship. It allows for more personalized management, optimizing both campaigns and value propositions.
Key indicators:
- RFM segments (Recency, Frequency, Value).
- Revenue per segment
- Conversion rate by group
- Customer lifecycle
Example of use: Adapt the commercial message according to the customer profile and increase the effectiveness of campaigns.
7. Customer Profitability Dashboard
Beyond sales volume, this dashboard reveals how much real value each customer brings to the business, considering revenue and service costs. It is essential for targeting resources towards sustainable relationships, detecting key customers and avoiding hidden losses.
Key indicators:
- Net margin per customer
- Cost of service per account
- Cumulative revenue
- Customer lifetime value (CLTV)
➡️ More information on: ABC Customer Analysis
8. Customer Journey Dashboard
This type of dashboard maps the different phases a customer goes through, from the first contact to customer loyalty. It visualizes abandonment rates, friction points and conversion times, helping to optimize the experience at each stage.
Key indicators:
- Conversion rate by stage.
- Abandonment by channel
- Average conversion time
- Cost per acquisition
➡️ Interested in the Customer Journey? You will find more detailed information in the Ebook: Customer Journey
9. Social Media Dashboard
Centralizes social media metrics to evaluate the impact of content, audience engagement and the return on digital actions. Allows you to compare performance by platform and adjust strategy in real time.
Key indicators:
- Followers, growth and reach.
- Engagement rate per content
- Brand sentiment
- CTR and conversions from networks
Example of use: Replicate high-performing content and redesign ineffective campaigns.
10. HR Dashboard or Team Performance
This dashboard helps to visualize the status and evolution of talent within the organization, from performance to work environment. It is key to link HR strategy with business objectives.
Key indicators:
- Voluntary and involuntary turnover.
- Absenteeism and presenteeism
- Performance evaluations
- Training participation
Strategic Benefit: Anticipate talent drain, strengthen professional development and improve internal satisfaction.
11. Dashboard of Cross-Selling and Up-Selling
Analyzes consumption patterns to discover cross-selling and up-selling opportunities. It is very useful in retail, ecommerce and B2B sectors with large portfolios.
Key indicators:
- Products purchased in aggregate.
- Upsell acceptance rate
- Average ticket per customer
- Revenue from upsell campaigns
Example of use: Generate automatic recommendations in the purchase process to increase the average value of each transaction.
12. Hotel Management Dashboard
This is a type of dashboard designed exclusively to offer a comprehensive view of the business to hotel chains.
Hotel Management Dashboards brings together all key indicators and data - operations, points of sale, sustainability, online reputation, etc.- in a single environment, avoiding data fragmentation and enabling a complete analysis of one or multiple hotels.

Key indicators:
- Occupancy, ADR, RevPAR
- Average online rating
- Costs per room
- Emissions and energy consumption
➡️ You will find more information in the Hotel Management Dashboards datasheet.
13. Power BI Viewer
This is a solution that allows you to view Power BI reports without the need for each user to have a license. In addition, it reinforces the governance and management of Power BI.
It is an ideal solution for organizations that must share reports and information with users outside the organization or with multiple internal users.
➡️ Find out how to save up to 80% on Power BI with Power BI Viewer.
14. Governance for Power BI
Governance for Power BI is a solution designed to centralize the governance of the Power BI environment, ensuring security, control and alignment with the organization's data strategy.
It allows you to manage access, organize content by business criteria, automatically document datasets and analyze user and workspace activity. Thanks to its complete traceability and without time limits, it improves efficiency and productivity within the Power BI environment.
Key indicators:
- Activity by user, workspace or report.
- Unauthorized or unusual access
- Documentation of datasets and DAX measures
- License usage and efficiency
- Usage heat maps
- Traceability of changes and duplications
➡️ Check out the technical features and use cases of Governance for Power BI here.
15. accoTOOL for Power BI
accoTOOL extends the capabilities of Power BI by allowing you to edit and write data directly from the report to a SQL database, without leaving the Power BI environment.
It integrates as a native visual, maintaining security and the data model, and facilitates tasks such as planning, data update or master management, thanks to extensions such as accoPLANNING and accoMASTERDATA.
Key features:
- Real-time data entry
- SQL integration
- Planning and management from within the dashboard
- Seamless and secure experience
Ideal for: Teams that need to collaborate, plan or update information directly from Power BI.
You already know the 15 essential dashboards.
If you want to implement them in your company with visual examples and detailed KPIs, download the complete guide.
How to choose the right dashboards?
Not all companies need all 15 Power BI dashboards immediately. To prioritize, it's a good idea to follow these rules:
- Align with current and future strategic objectives.
- Listen to the needs of functional departments.
- Assess the level of analytical maturity.
- Ensure a solid foundation in architecture and data quality.
Recommendations for Successful Dashboard Implementation
- Choose flexible platforms such as Power BI.
- Define clear and actionable KPIs.
- Automate data refreshes and updates.
- Design clean, decision-focused visualizations.
- Control access according to roles and needs.
- Document sources, measures and objectives.
- Measures impact and continuous improvement.
Conclusion: Dashboard as a Strategic Ally
Business dashboards are not just visual tools, they are decision systems. In 2025, those who don't measure don't improve, and those who don't act with data will be left behind.
A well-designed dashboard gives you what no report can: a direct, transversal and strategic reading of the state of the business.
Ready to get started?
Download our free guide with the 15 essential dashboards and transform your decisions into competitive advantages:
Transform Your Business With Strategic Dashboards
📩Download the complete guide and start making truly data-driven decisions.


