Better City Indicators helps you manage your city better by letting you collect, compare, and visualize data so you can learn critical insights
We are living on the cusp of a technological revolution that will soon change the way we all live. This revolution centers around data - what we can do with it and how we can learn from it. The advancements in data mining technologies have led to the unearthing of huge sets of data everywhere, from our city streets to our home appliances. With the appropriate tools, we have learned to transform this data into information, and then into knowledge. With this knowledge, we are turning our cities into Smart Cities, and bigov Better City Indicators (BCI) can help you manage your city's data more intelligently.
Data is collected from many sources throughout a city. Until recently, the world didn't have an internationally recognized set of standards to compare and contrast how well any given city serves its populace. The Geneva-based International Organization for Standardization released in 2014 its new set of city indicator standards for cities to follow, based on a wide range of factors such as environment, infrastructure, economy, civil society, government, and much more.
Inspired by the City Protocol Society, bigov Better City Indicators lets you organize your city's indicators. With this solution, you can monitor and visualize your data in rich chart sets to let you understand trends better and see patterns more clearly, arming you with more information and knowledge of how your city works. Here are five ways bigov Better City Indicators helps you manage your city better.
1. Water

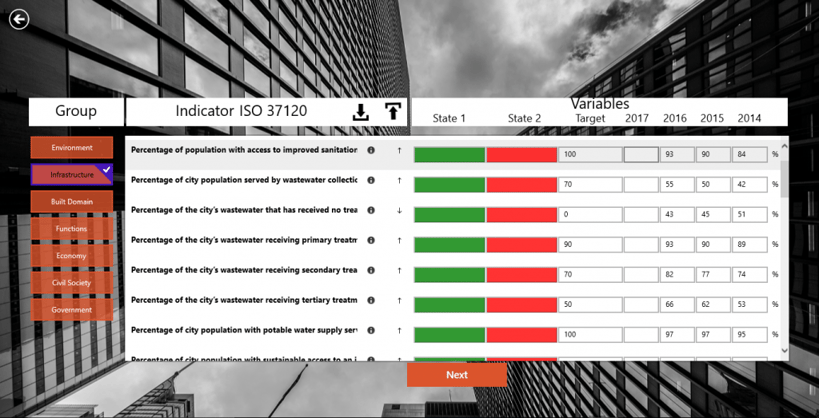
Water is a precious resource that nobody across the world should take for granted. The state of California has been experiencing "exceptional" drought for a number of years now, with water conservation efforts taking place across the city. Every city should be prepared to deal with whatever the future holds, and the first steps towards this goal should be strict monitoring of how your city manages its water.
With bigov Better City Indicators, you can track the state of your city's efforts to deal appropriately with wastewater. You can see if your city is doing well or poorly with indicators like percentages of wastewater that has received no treatment, or primary, secondary, and tertiary treatment. You can track what percentage of your city's population has access to clean drinking water and improved facilities, giving you a good indication of how your city stands in its water quality management.
2. Economy
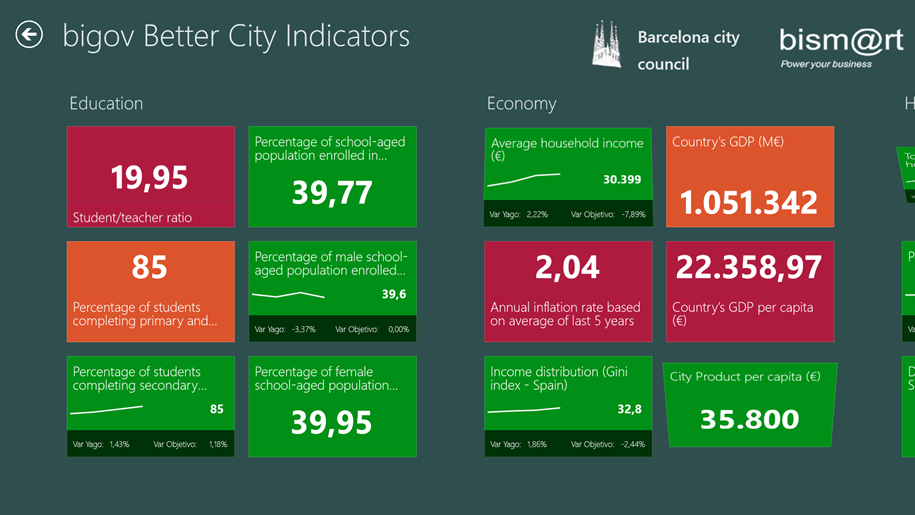
A happy city is built on a strong economy. If your citizens overall have employment and good means of income, your city will flourish. Your city's economic performance can now be measured, compared, and contrasted to other partaking worldwide cities thanks to the use of city indicators.
Better City Indicators allows you to identify employment/unemployment trends by comparing with data from different years. With indicators such as youth unemployment rate, debt service ratio, household saving rate, capital spending as a percentage of total expenditures, and many more, you can track your city's economic performance and learn key insights very easily. You can even track how well your city caters for new businesses with indicators like number of new patents per 100,000 population per year, number of new companies per 100,000 population per year, and own-source revenue as a percentage of total revenues.
3. Transportation
How do people get around your city? How efficient is the public transport of your city? Is there too much congestion on your streets?
With bigov BCI you can track the number of personal automobiles per capita, the number of public transport trips taken per capita, and the number of commutes taken in forms of transport other than automobiles, giving you a much more informed idea of how your city moves around. Also, with Bismart's Traffic Fatalities Prevention solution you can get a much more in-depth view of where, when, how, and why road accidents occur in your city, allowing you to take preventative steps ahead of time to counteract them.
4. Environment
By implementing the app into the management of your city, you'll be able to see which direction your city is moving in terms of the environment. With the Paris Climate Agreement having entered into force in November 2016, nations and cities must be a lot more conscious about keeping their harmful emissions to an absolute minimum.
bigov BCI helps you keep on top of the pollution levels in your city - CO2 emissions, particulate matter and fine particulate matter concentrations, sulphur dioxide, ozone, and nitrogen dioxide concentrations, among other things. It also helps you track how well you're doing on any commitment to reducing noise pollution you've implemented, as well as things like seismic risk, flood risk, and even your solar radiation.
5. Emergencies
How well can your city cope with emergency situations? Are you deploying your available resources in the right manner and spread across the areas that most need it? Having properly equipped emergency services can make an enormous difference to your city's wellbeing and bigov Better City Indicators can help you toward that goal.
The app contains city indicators related to your emergency services, with number of fire-related deaths, number of in-patient hospital beds per population just two of the extremely detailed indicators available to use. You can also see how many firefighters, police officers and physicians are working to serve your citizens.
Better City Indicators Free App and Tour App
bigov Better City Indicators is available for free on the Windows App store. You can also download a free Tour App of bigov Better City Indicators to help guide you through the app, indicators, and how it all works.