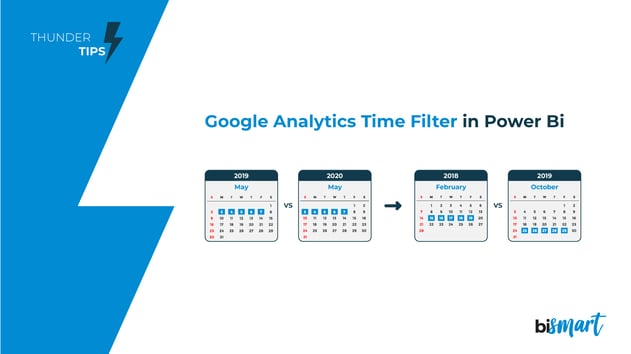
Discover how to apply the Google Analytics time period comparison filter to Power BI and take your reports to a new level!
Power BI is one of the best business intelligence tools according to Garnter, but it does not include a filter to compare different time periods. Google Analytics, on the other hand, has a much more powerful time period comparison filter, but it is not a BI tool and is only useful for analyzing web traffic.
Do you want to know how to apply the Google Analytics random date comparison filter in Power BI? Keep reading!
In this article you will find...
- Video: Bismart Thunder Tips 01: Google Analytics Time Filter in Power BI
- How To Apply Google Analytics' Time Filter To Power BI?
- 1. Build The Model
- 2. Create The Formula
- 3. What Are The Benefits Of Google Analytics Time Filter?
If you work in the marketing department of a company or you are a data analyst, you have probably used the Google Analytics time filter to analyze data related to your web traffic.
The filter that enables to compare two periods of time is one of the most valued options of Google Analytics since it allows businesses to analyze the metrics of their company by means of customized time periods that are not related to each other. This possibility is extremely useful to achieve a diachronic understanding of your company's data and its evolution.
At Bismart, as a preferred Microsoft Power BI partner in Spain, we are always looking for new ways to use Power BI to take our reports to the next level and get the most out of our data. In this video, our Senior BI Consultant, Ricardo Rincón, explains how to apply this filter to Power BI so that anyone in the company can match the two time periods they want, in the same way they do with Google Analytics, but now directly in Power BI.
Currently, while Power BI allows you to compare specific time periods —the current week with the previous week, a month with respect to the previous month, etc.— it does not support comparison between custom periods, which could be very useful for analyzing metrics for specific dates such as, for example, Easter.
Learn how to add it!
If you would rather learn the steps without watching the video, here is how you can apply Google Analytics' time filter to Power BI:
How To Apply Google Analytics' Time Filter To Power BI?
In order for the filter to work the same as the Google Analytics one, first of all it is necessary to equalize the values of both time intervals - because with this filter you can select time periods of different lengths. Then, we must normalize the values of the different periods so that they can be compared without the inclusion of errors or malfunctions.
To apply the filter to Power BI we only have to follow these 2 simple steps:
- Build a model that allows the user to make 2 different selections on the same date field.
- Write a DAX formula that computes the same value in both periods.
1. Build The Model
The first step is to open Power BI and create a new 'Date' table. Doing this is as simple as making a copy of the existing table. Once we have made the copy, we must link both tables with 1:1 correspondence and finally, create a relationship between them with bidirectional filtering that, for now, we will leave inactive.
We must do the same with all the other metrics that we want to compare.
2. Create The Formula
Once we have all the related tables, we must create a DAX formula so that both have the same value. The formula that we must apply is the following:
- In 'CALCULATE' we write the original metric —in this case 'Net Sales'—.
- In 'ALL' we express the table where we have applied the duplicate filter, in this case 'Calendar'.
- Finally, with 'USERELATIONSHIP' we activate the relationship between the two tables —the original one and the one we have duplicated—.
What Are The Benefits of Google Analytics Time Filter?
Google Analytics time filter in Power BI will allow you to compare time periods of distinct durations and, therefore, to elaborate more accurate and complete reports and draw much more detailed and advanced conclusions about your metrics. Thus, you will be able to analyze your business strategies in much greater depth and assess which have been efficient, which have failed and how you could improve them. In short, you will get much more accurate information that will allow you to make better data-driven decisions.
The Google Analytics filter is especially necessary in the hotel industry. At Bismart, a partner Power BI company, we have worked on the creation of specialized solutions for hotels on numerous occasions using Power BI —such as our Hotel Management Dashboards solution— and we are aware of how essential it is to compare time frames in this sector. For the proper functioning and performance of a hotel chain, it is essential to have valuable information on customer behavior according to time periods, since turnover tends to be highly variable depending on the season of the year, days of the week, holidays, special dates, vacation time, etc. In fact, the time of purchase is a key variable when classifying a hotel's customers. By default, Power BI does not allow the comparison of metrics between days of the week, weeks, months, or dates such as holidays, etc. Because of all this, the Google Analytics filter it can be extremely useful and having it directly in Power BI can be a huge step for hotel chains.
Obviously, the Google Analytics filter in Power BI can translate into better analysis and business strategies for any company, whatever the industry.
This task is extremely useful to take your Power BI reports, statistics and dashboards to another level. Basically, using this filter you will be able to optimize your organization's insights and examine your business operations more thoroughly in order to draw more accurate conclusions. Not only will you achieve many more insights, but they will be much deeper and reliable.
Through this filter you will be able to discover:
- How holidays and specific dates affect your business.
- How customers behave according to the time of year, the month or the time of the week.
- How traffic to your website or other channels has increased or decreased in different periods.
- When it is most effective to launch new products or services, campaigns, strategic marketing operations and advertising content.
- Which strategic operations have provided the greatest return on investment and which have failed.
- What is the relationship between any business operation and any insight.
- Find out about any tracking issues you should check out.
These are just some of the improvements that the Google Analytics time filter can bring to your business intelligence initiatives when added to Power BI. Without a doubt, comparing time frames will help you improve your strategic decisions, discover opportunities and inefficiencies and, in short, it will incredibly optimize the data analysis process. In addition, this discovery will mean substantial time saving and will facilitate the work of your analysts and data scientists who will no longer have to use two different applications and will be able to compare dates in Power BI.
Go a try it! What are you waiting for?!
If you find this content interesting, you can access many more tips by subscribing to our YouTube channel or subscribing to the Bismart blog below: