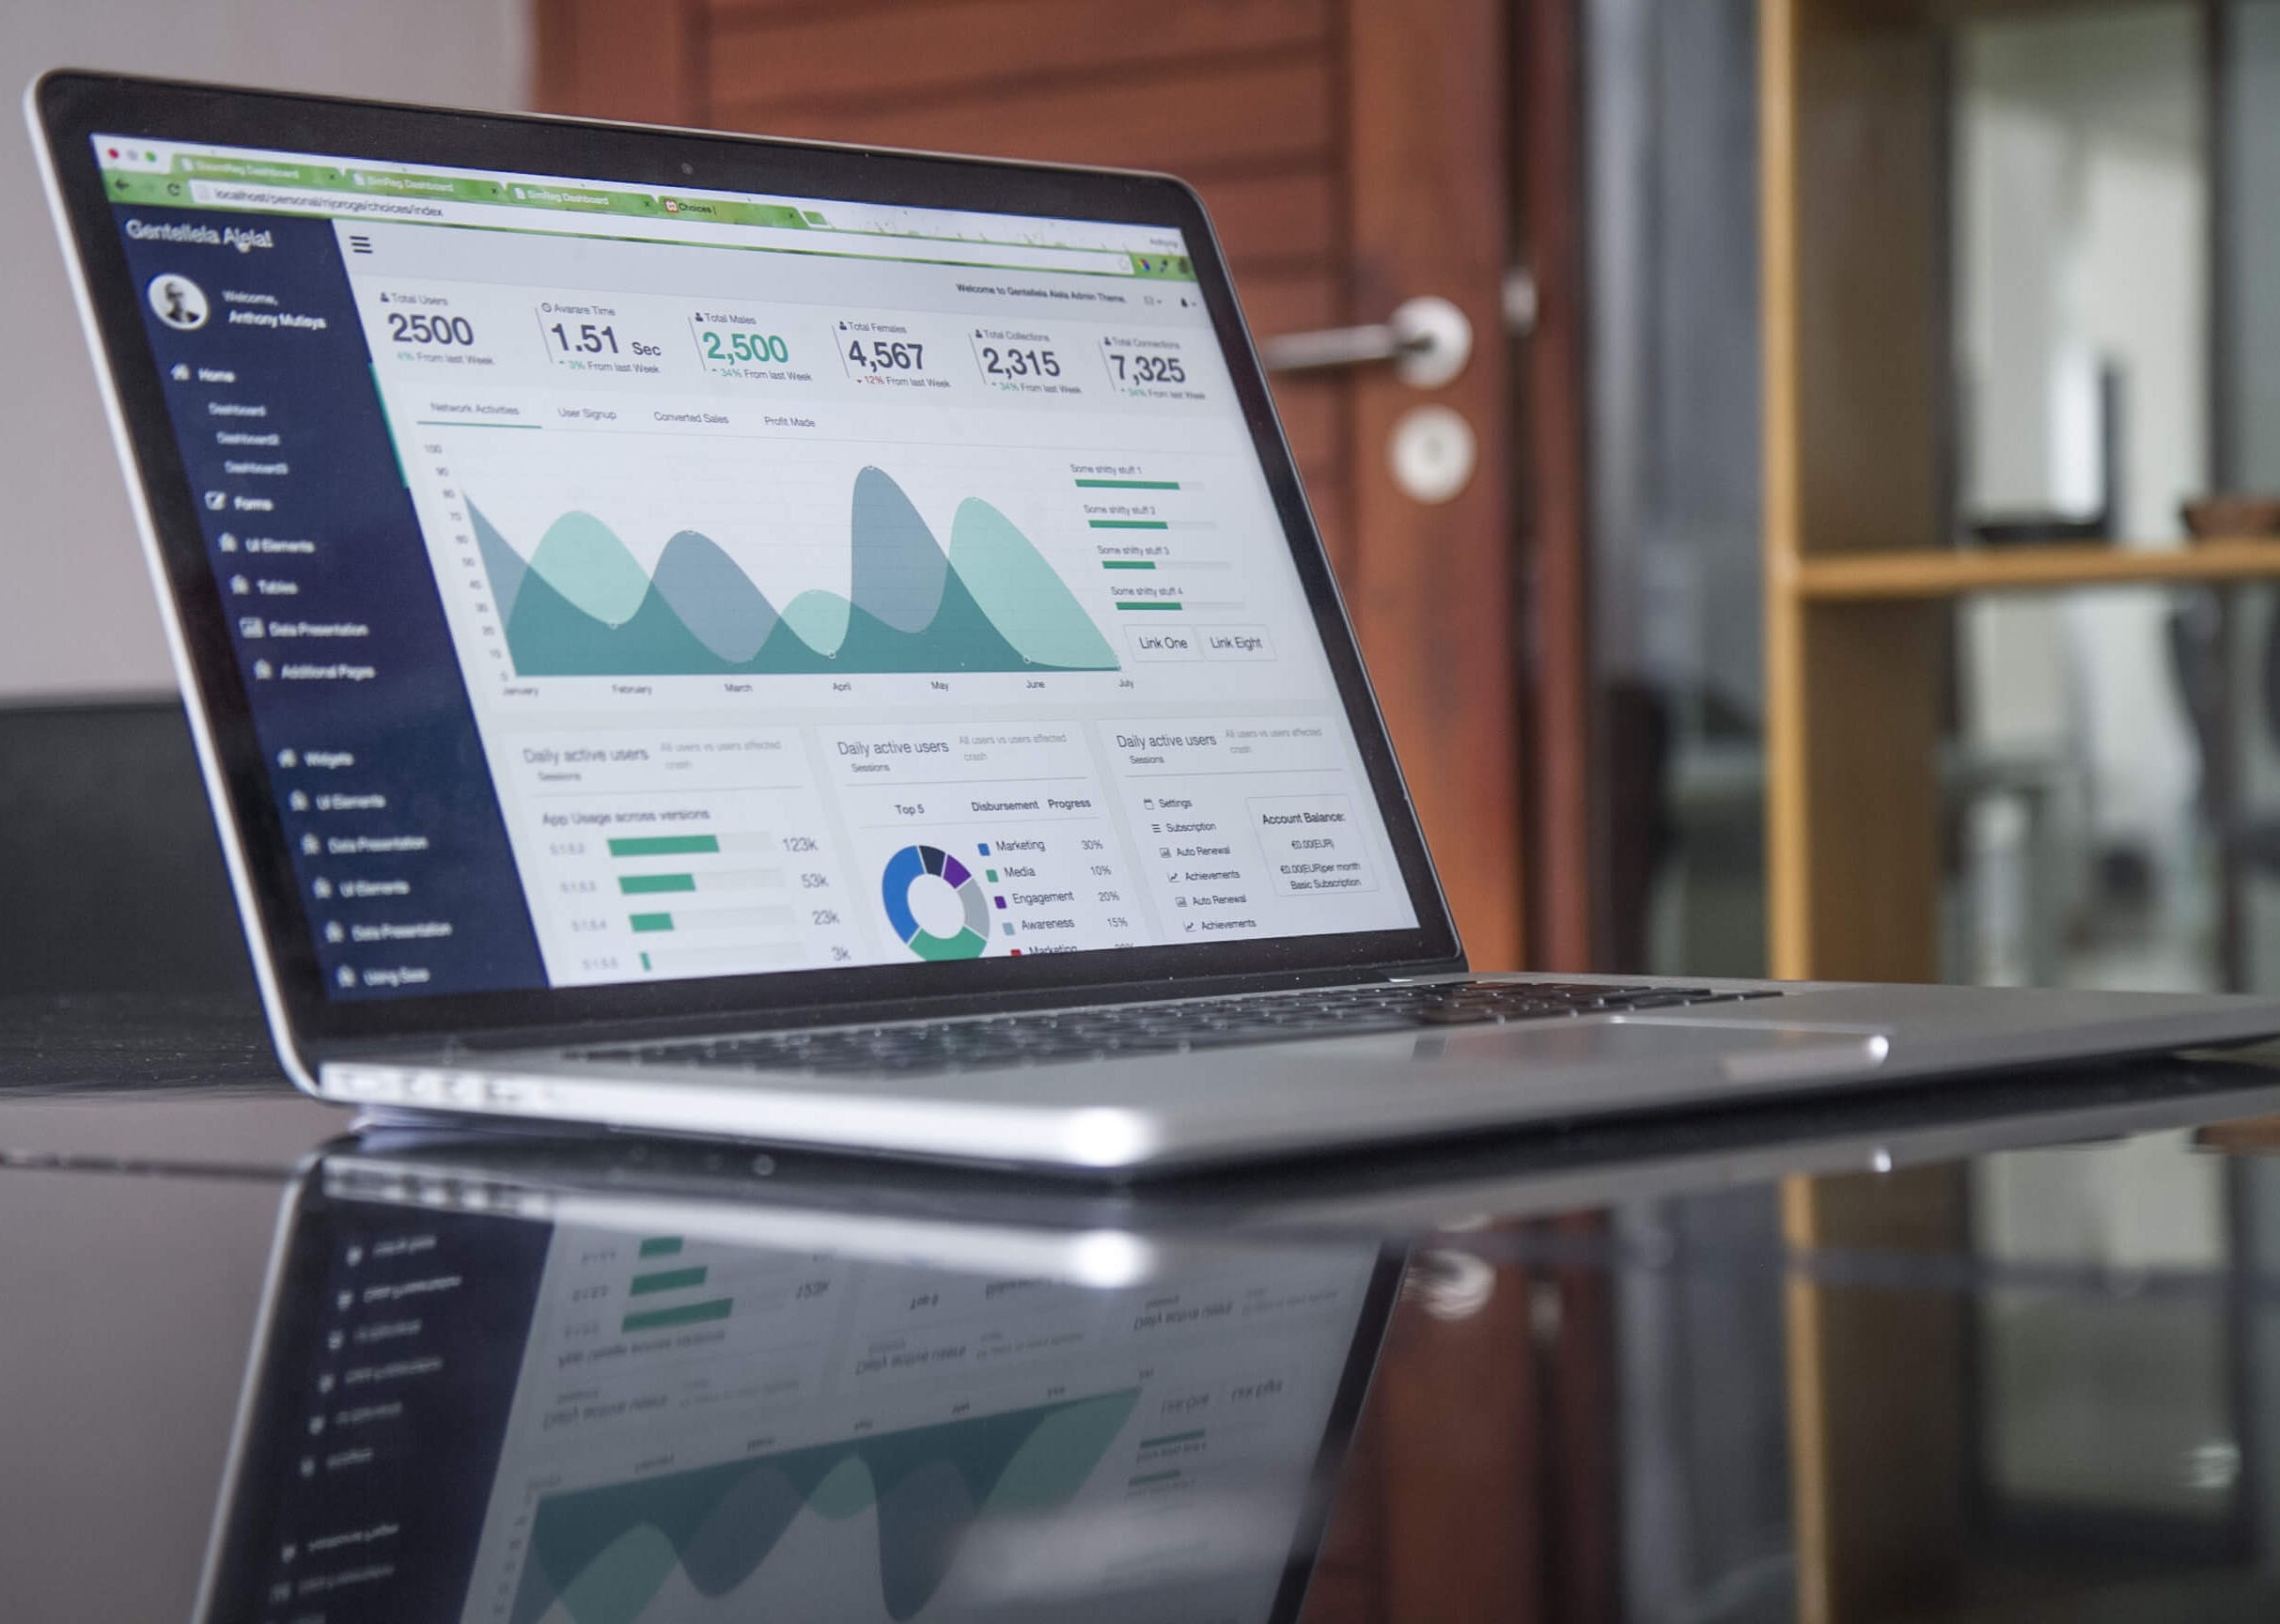
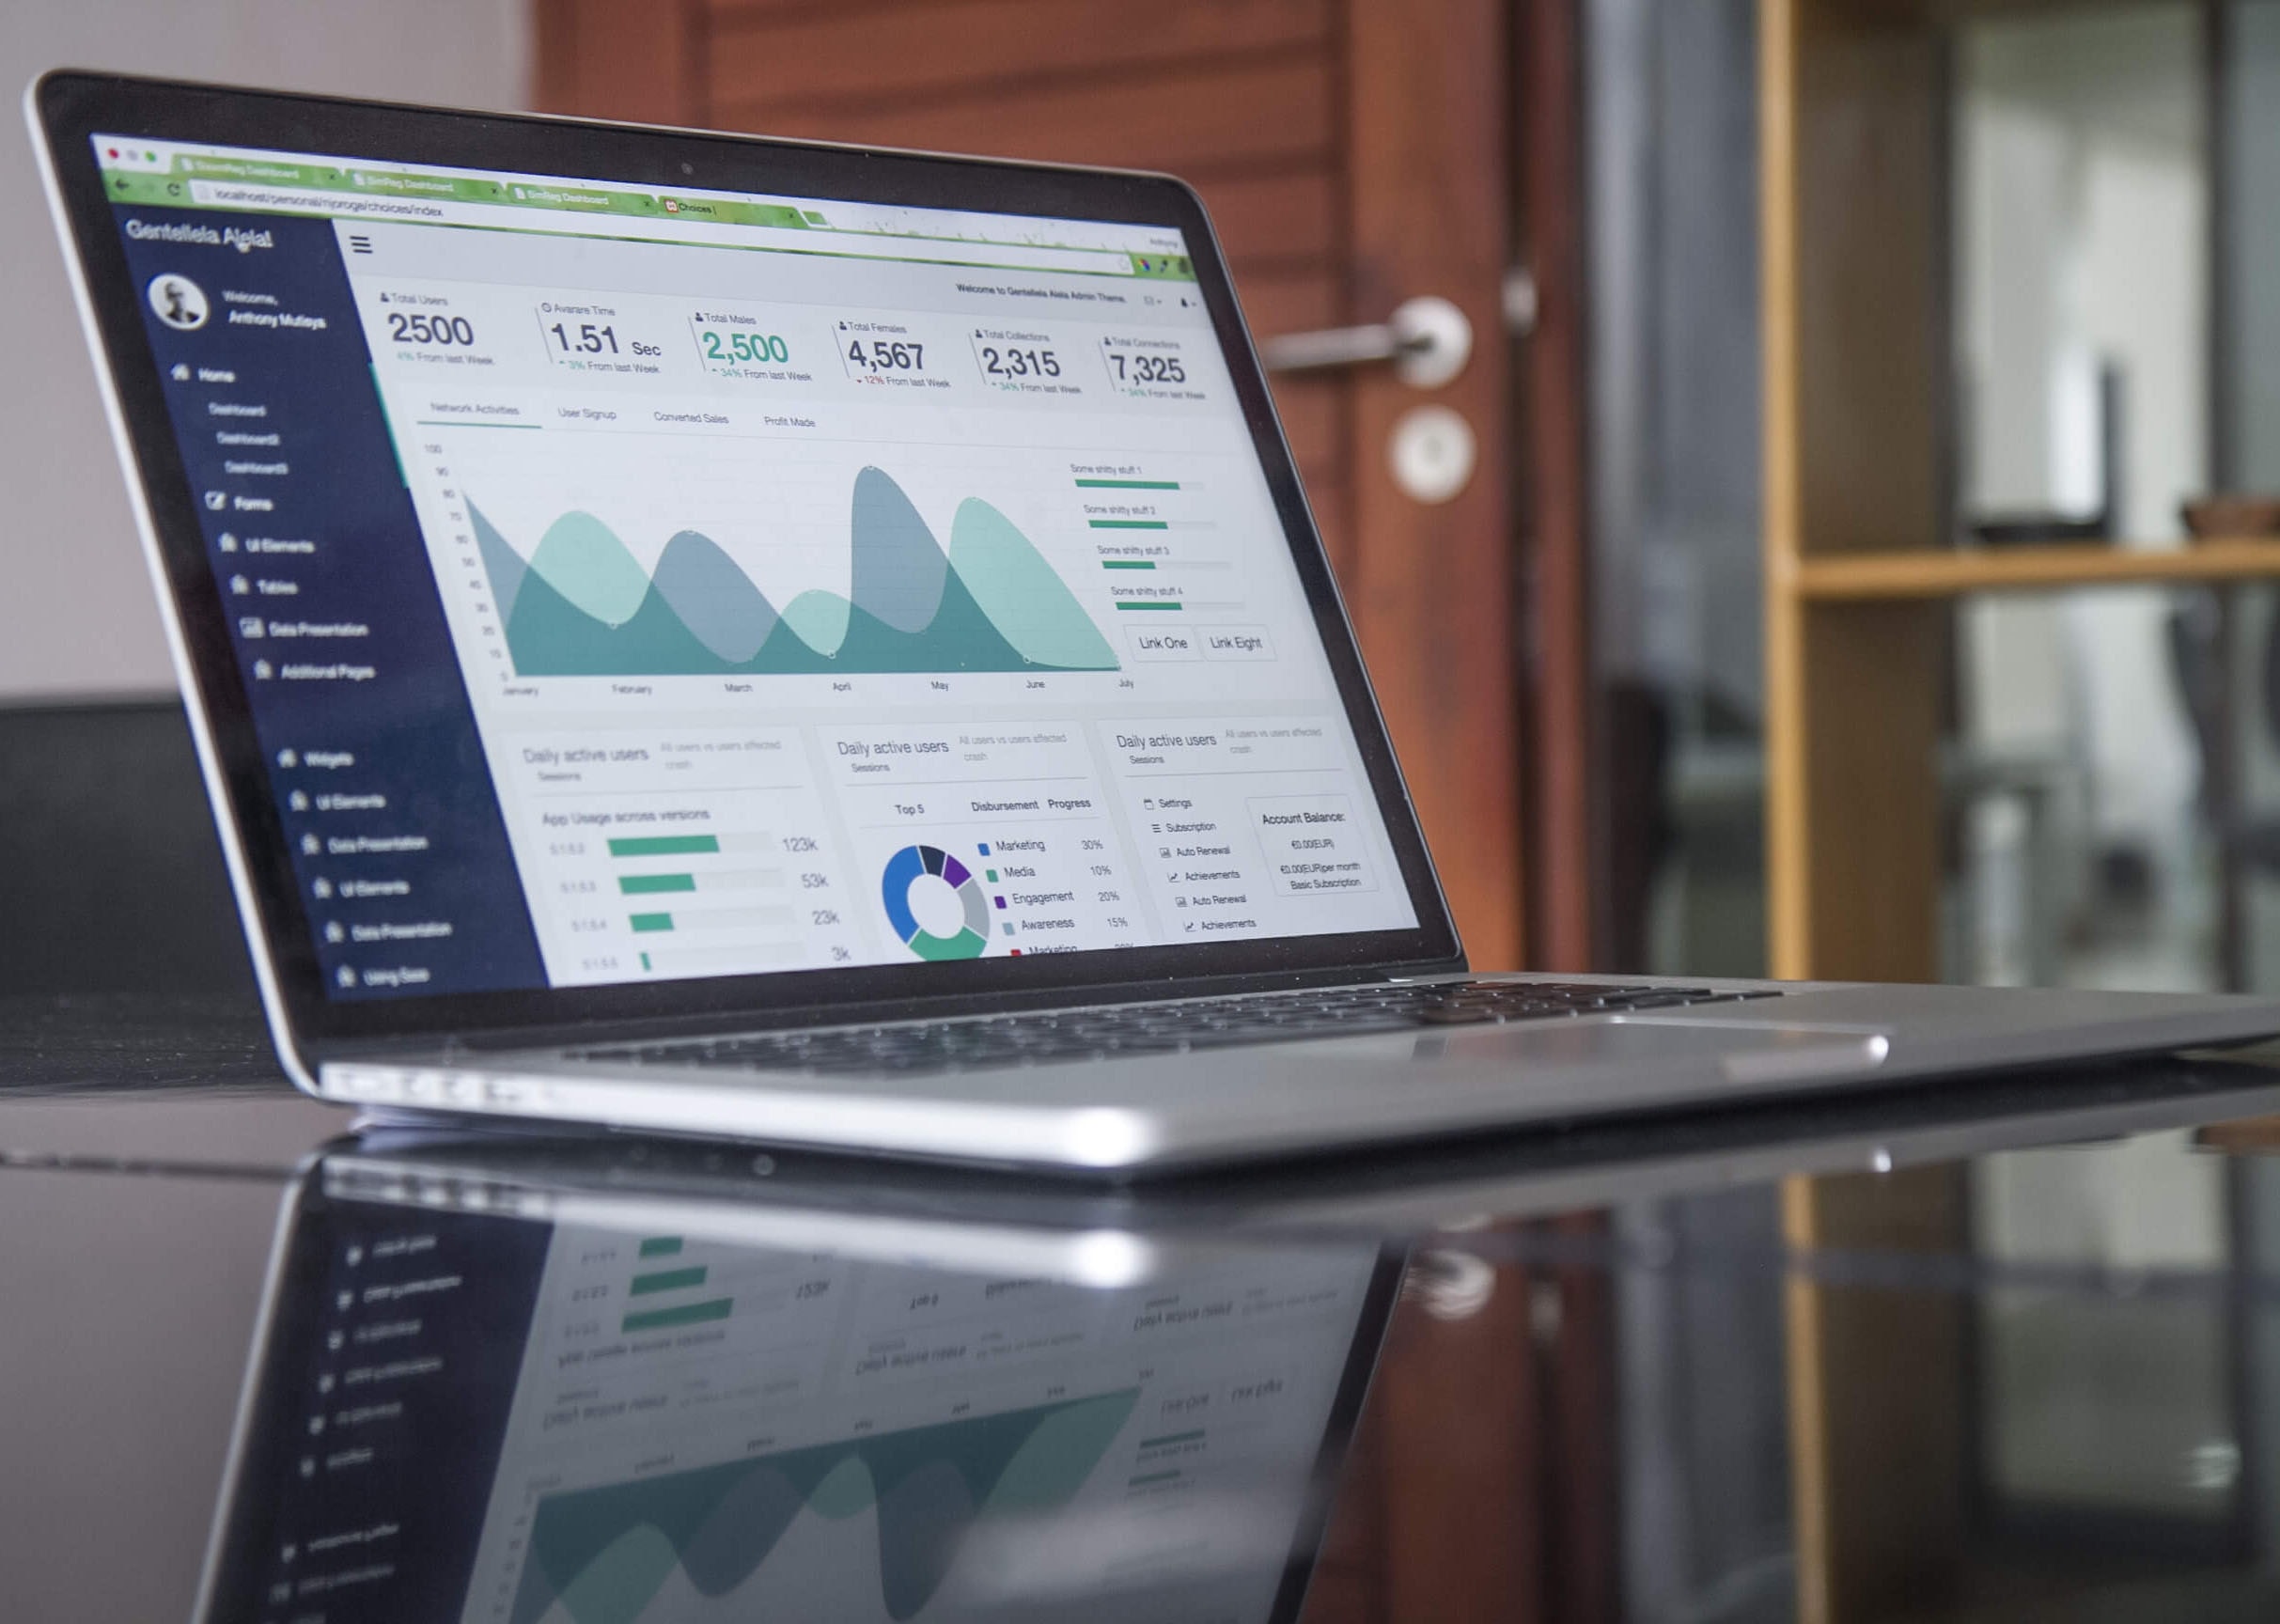
Dashboards are essential for the smooth running of a business. However, their efficiency depends on their correct implementation.
In the era of digital transformation, business leaders are exposed to a large amount of information and 'noise' that can hinder business decision-making. Fortunately, digitalisation has also introduced new technologies that enable the creation of personalised dashboards in real time, which have the potential to transform the way leaders make decisions.

Today, the most important information regarding business activity can normally be found in a dashboard, especially in an executive dashboard or corporate Balanced Scorecard.
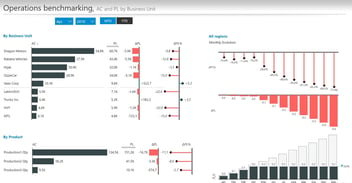
Dashboards are centralised tools that collect the most important data from across the company, providing an up-to-date snapshot of what is happening, where and even why. In addition, they can alert you to areas that need immediate attention and provide quick access to project-specific details for course corrections if necessary. These dashboards are not only beneficial for senior management, but are helpful at all levels of the business. Of course, there are different types of dashboards and their format and functionality must be tailored to the information they contain.
According to a 2022 research, companies that use real-time analytic dashboards are further along in their transformation, deliver a better employee experience, are more successful at innovation and grow revenue faster than those that do not.
In short, dashboards are an essential tool for making the most of digital transformation and achieving business success.
Would like to optimise your organisation's dashboards? Download our guide with 21 best practices for creating reports and dashboards in Power BI.
The consequences of noise
A decade ago, researchers at Princeton University conducted a study with four volunteers and 19 laboratory rats to analyse the effect of information quality on decision-making. The results revealed that the participants had no problems processing logical information and making optimal decisions. However, when external "noise", such as clicks, was introduced, the respondents made mistakes and got off track.
The same can happen in any environment and shows that business leaders must always be alert to what is going on in their teams at all levels of an organisation. They must also be aware of what is happening outside the organisation. In other words, they need access to high-quality data and information to be able to do their job to the best of their ability. However, too much information can cause noise and hinder data-driven decisions.
To make good decisions, companies —especially those at the highest levels of the organization— need accurate, relevant and contextualised information. Leaders must have the ability and access to technologies that allow them to filter out the "noise" and focus on the relevant information to achieve defined objectives. That's why dashboards are an essential tool, since they transform information into clear stories and filter the noise, making decisions easier.
Implementing an effective scorecard
Dashboard implementation is a process of constant improvement that requires adapting to changing circumstances and aligning indicators to the organisation's objectives. The process of implementing a dashboard requires a number of factors to ensure that the tool will deliver the expected results.
Firstly, it is important to correctly define the performance indicators and KPIs to be displayed on the dashboard to ensure a single readability, which involves considering aspects such as purpose, calculation method and data source. The number of indicators must be adequate, as both too little and too much information can be problematic.
The availability and quality of the data needed to calculate the indicators is key to ensure that the information is always available, to minimise the efforts to obtain it and to ensure that the data is accurate.
On the other hand, data visualisation criteria and care for the user experience are essential to facilitate the use and understanding of the information.
There are several strategies that can contribute to the successful implementation of a dashboard.
- Top-down approach: From the definition of the strategic objectives to the definition of the data that will allow the necessary indicators to be gathered to measure the efficiency in achieving these objectives.
-
Involvement of the management team in the initial and final phases of the project, to ensure adequate definition and review/validation of the results obtained.
- Adequate definition of the indicators, which implies specifying the purpose, calculation method, data source and other relevant metadata to ensure a single interpretation of the results.
- Using an appropriate number of indicators, as both too little and too much information can lead to problems.
- Availability and quality of the data needed for the calculation of the indicators, in order to ensure that the information is always available, to minimise the efforts to obtain it and to ensure the veracity of the data.
- User-oriented tools to facilitate the use and correct interpretation of the results in a visual and interactive way. Highlighting the most relevant results in predefined reports and allowing the creation of ad-hoc reports for a better analysis and diagnosis of the results.
At Bismart we have created a guide that includes the 21 best reporting practices for Power BI.
Also, it is essential to be prepared for surprises, as dashboards can help to uncover new data that may be critical for decision making.
In conclusion, the implementation of a scorecard or dashboard is an ongoing process that requires constant efforts to ensure its proper functioning and to adapt to the needs of the organisation.


