Are your business intelligence tools aligned with your business needs and objectives? Take a look at the 5 best BI softwares on the market.
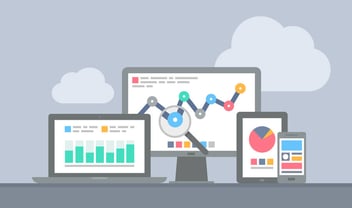
Business Intelligence tools help companies make better decisions by providing them with detailed, up-to-date information and analysis. BI softwares allow businesses to accurately measure performance, identify trends, forecast future outcomes, analyze customer behavior, and compare data from different sources. We review the top 5 best BI software and business intelligence tools on the market.

Business intelligence (BI) software help companies make better decisions by providing them with information and data-driven insights about their operations and activity. BI software collects and stores data from various sources, including internal databases, cloud services, and external applications. It then analyzes this data to uncover trends and patterns that can be used to inform strategic decisions. This enables businesses to improve processes, reduce costs, identify opportunities for growth, and enhance the customer experience.
Nowadays, choosing the right business intelligence tools for each company is complicated by the wide variety of options on the market. In this sense, we must be clear that most of the leading technologies on the market have sufficient capabilities to improve performance. However, the efficiency of one software or another will depend on the particularities and specific needs of the business.
The best Business Intelligence (BI) software and tools on the marketThere are many different types of business intelligence tools on the market today, each offering unique capabilities and features to meet specific needs.
To help you choose the best one for your organization’s requirements, here is a look at some of the top BI solutions available:
1. Power BI
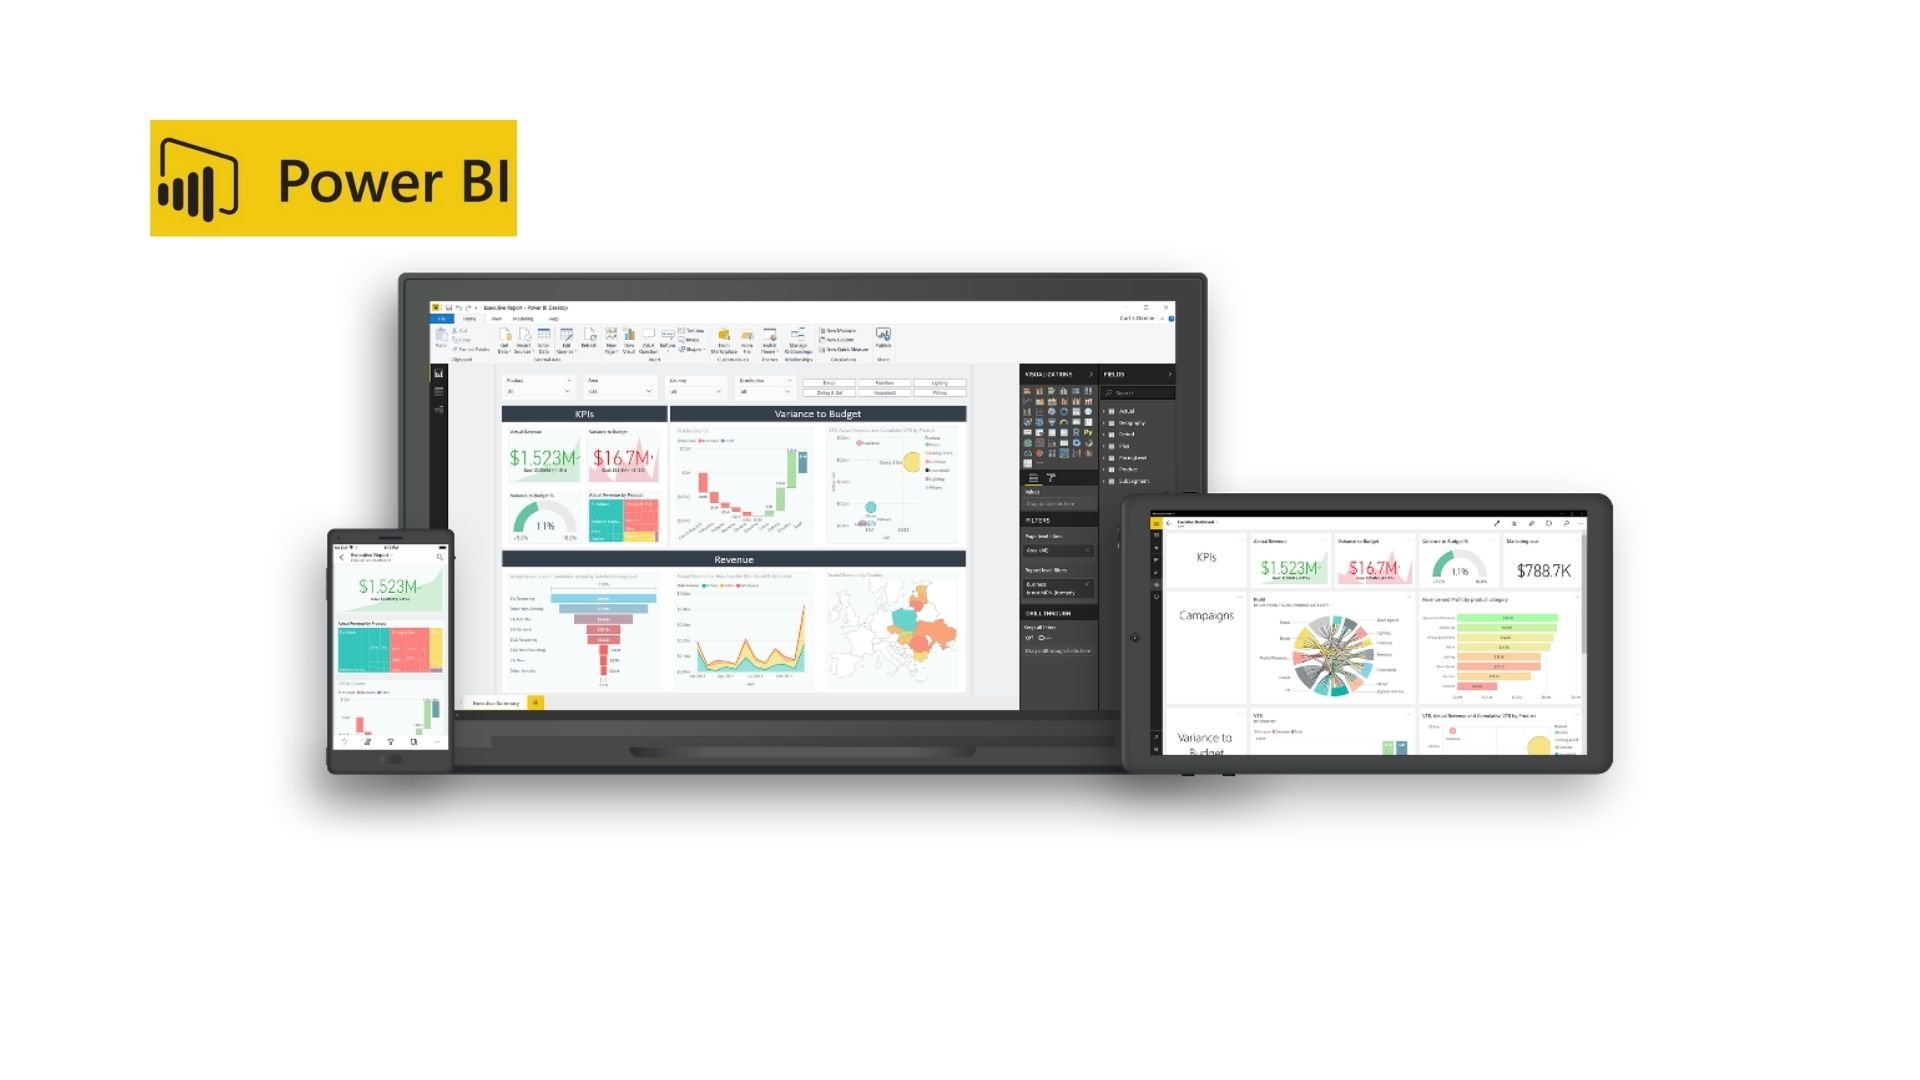 Microsoft Power BI provides powerful self-service analytics capabilities that allow users to explore data without relying on IT support or specialized skillsets. It offers a wide range of data visualization options along with natural language query (NLQ) functionality which enables users to ask questions about their data using plain English instead of complex SQL queries.
Power BI also integrates seamlessly with other popular Microsoft products such as Excel and SharePoint making it ideal for larger enterprises looking for comprehensive visibility across all departments within their organization.
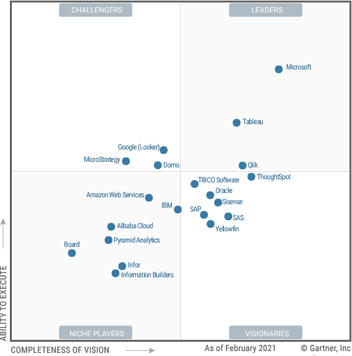
According to Gartner, Power BI is the best BI and analytics tool on the market because it provides a comprehensive and easy to use platform for users to build, analyze, and visualize data. It allows users to quickly create insightful visuals, such as charts and graphs, from their data sets, helping them make better decisions.
Finally, Power BI offers a range of features designed to help organizations effectively collaborate across teams while also providing secure access to sensitive information.
Power BI: Best features
- 1. Interactive Visualizations: Power BI offers a wide range of interactive visualizations, including maps, charts, tables and graphs. This makes it easy to explore data quickly and gain insights from the visuals.
- 2. Natural Language Queries: With natural language queries (NLQ), you can ask questions in plain English about your data and get answers back in an instant. This feature helps reduce time spent searching for answers in complex datasets and allows users to gain new insights faster than ever before.
- 3. Robust Data Connectivity: Power BI has powerful connectivity features that allow you to connect with almost any type of data source, from traditional databases like SQL Server or Oracle to cloud-based sources such as Salesforce or Google Analytics, so you can easily access all the information needed for analysis without having to manually enter it into the system yourself.
- 4. Automated Insights & Alerts: With automated insights, Power BI can detect patterns in your data and make predictions based on them, giving you valuable insight into what’s happening now and what might happen next so that you can take action accordingly . It also sends alerts when something unexpected occurs so that you don’t miss out on important opportunities or risks related to your business performance metrics.
At Bismart, as a preferred Microsoft Power BI partner, we have a large team of certified Power BI experts who have developed a guide with the 21 best reporting practices for Power BI. Streamline your Power BI reports and dashboards with our guide!
2. Tableau
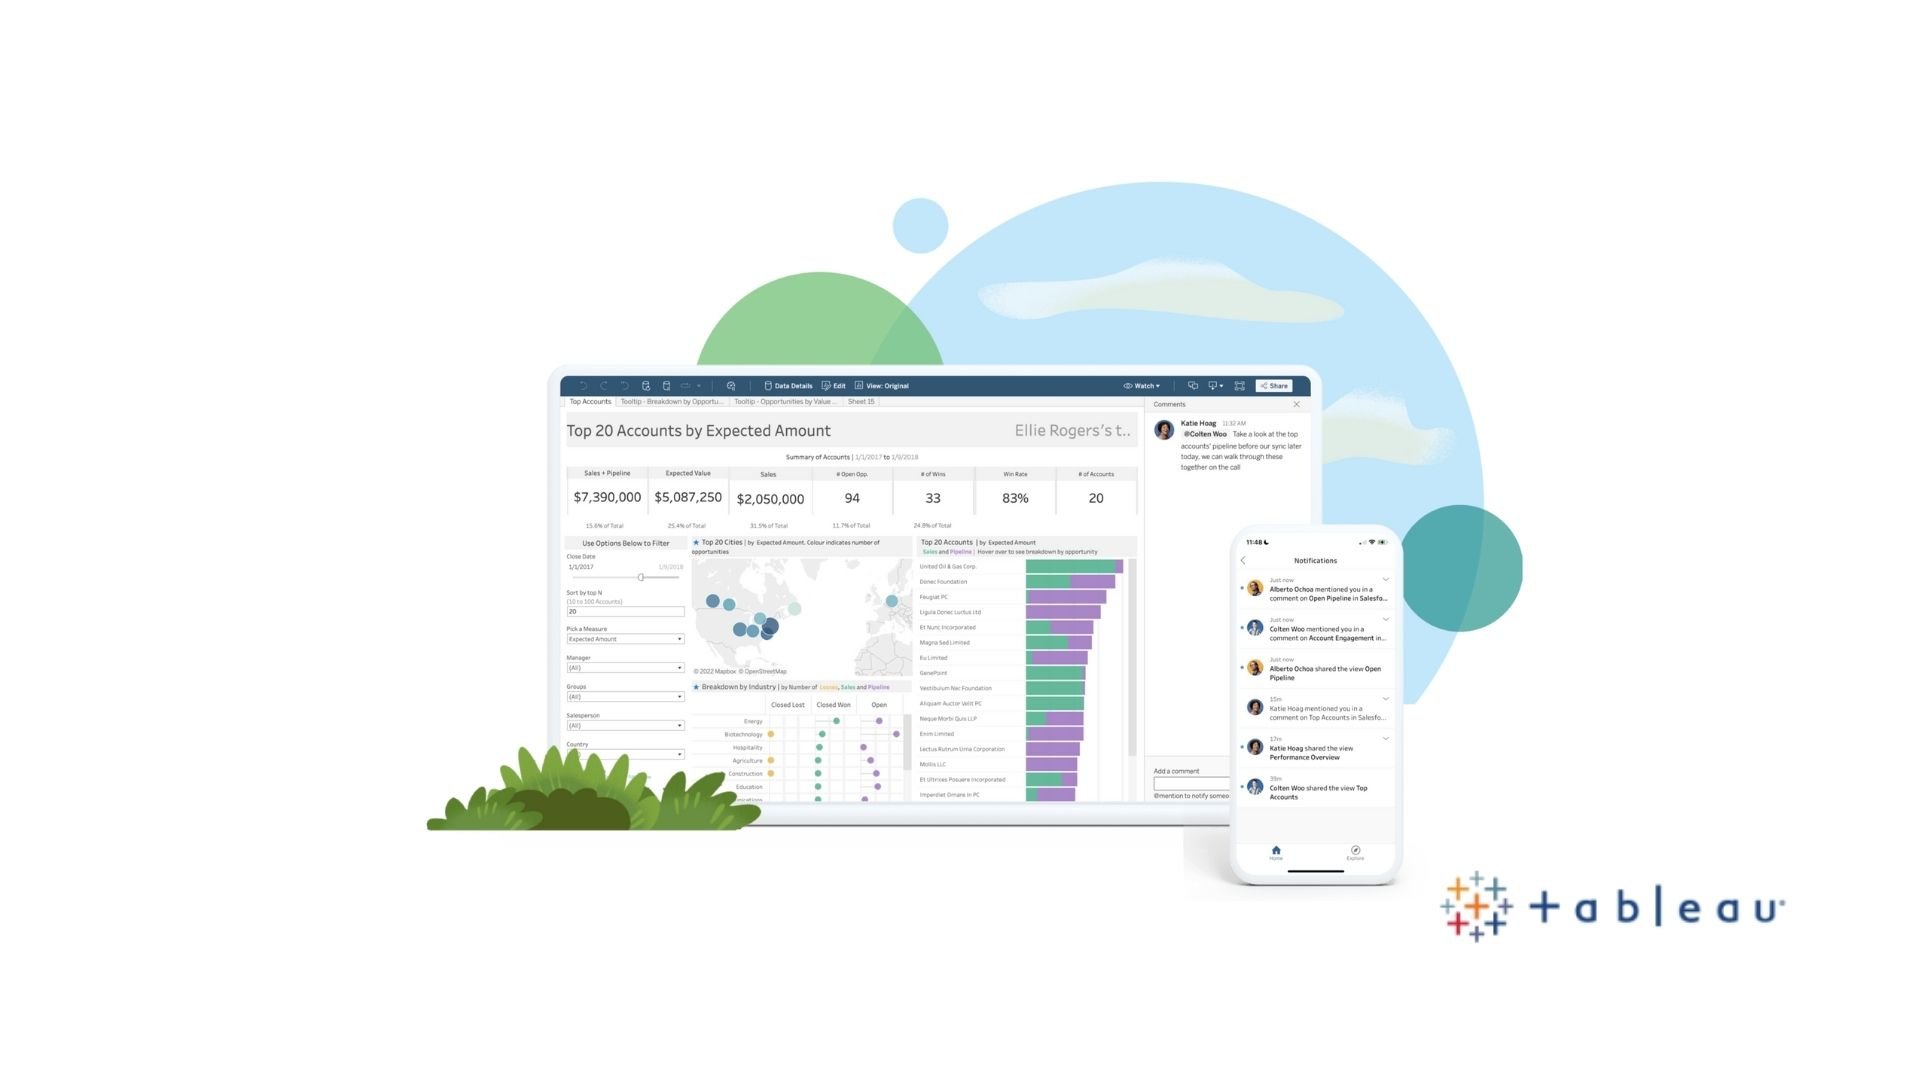
Tableau is widely recognized as one of the most user-friendly business intelligence tools in existence. Its drag-and-drop interface makes it easy to create interactive dashboards with visualizations from multiple sources like spreadsheets or databases. The platform also offers advanced analytics capabilities including predictive analysis and advanced forecasting models so users can anticipate future trends with confidence.
Tableau provides an intuitive, user-friendly interface that makes it easy to create interactive dashboards and data visualizations. With Tableau, users can quickly analyze large datasets with advanced analytics capabilities such as forecasting and predictive modeling. Additionally, Tableau integrates seamlessly with popular databases like Oracle, SQL Server, MySQL, PostgresSQL and many others making it easy to access data from multiple sources. Finally, its powerful visualization capabilities allow users to easily identify patterns in their data so they can make better decisions faster.
Tableau best features
- 1. Easy-to-Use Visualization Tools: Tableau’s drag-and-drop interface makes it easy to create visuals from any data source.
- 2. Robust Data Connectivity: Tableau can connect to almost any type of data, including relational databases, cloud platforms, spreadsheets and big data sources.
- 3. Fast Insight Generation: With its in-memory technology, Tableau can generate insights quickly by analyzing large amounts of data at lightning speeds.
- 4. Customizable Dashboards and Reports: You can customize your dashboards and reports with interactive filters, parameters and calculations for powerful analysis and storytelling capabilities.
- 5. Extensive Collaboration Tools: Tableau offers a wide range of collaboration tools that enable teams to work together on projects in real time from anywhere in the world
- 6. AI & Machine Learning Integration: Tableau has integrated artificial intelligence (AI) into its platform so users can access advanced analytics features such as natural language query (NLQ), predictive modeling and forecasting without having to learn complex programming languages like Python or R.
3. Qlik Sense
Qlik Sense is another leading business intelligence solution designed specifically for enterprise customers who need sophisticated reporting capabilities but don’t want to invest heavily in IT infrastructure or expertise required by more traditional solutions like Cognos or Business Objects Enterprise Suite (BOES). This cloud based solution allows users to easily build dynamic dashboards combining multiple datasets from different sources giving them a complete picture at any given time while allowing collaboration among team members through its secure sharing feature.
QlikSense provides an intuitive user interface with drag-and-drop functionality and interactive charts, allowing you to explore your data in real time. Additionally, QlikSense offers advanced analytics features such as predictive analytics, natural language processing (NLP), machine learning algorithms and more. This makes it ideal for organizations looking for a solution that can give them deeper insights into their data and help them make better business decisions.
QlikSense: Best features
- 1. Scalability: Qlik Sense is a highly scalable platform that can easily be adapted to the needs of any business, regardless of size or complexity.
- 2. Automated Data Discovery and Analysis: Qlik Sense allows users to quickly explore data from multiple sources with its automated data discovery capabilities and intuitive drag-and-drop interface. This helps make it easier for users to find insights in their data without having to manually search through various tables and spreadsheets.
- 3. Advanced Visualization Tools: With its advanced visualization tools, Qlik Sense makes it easy for users to create interactive charts, graphs, maps, and other visualizations that bring their data alive on the screen. In addition, these visuals are fully customizable so they can easily fit within existing dashboards or reports as needed.
- 4. Security & Privacy: Qlik Sense provides robust security features including authentication protocols like single sign-on (SSO) and two factor authentication (2FA). Additionally, all customer data is encrypted while in transit and at rest which ensures complete privacy protection for your sensitive information when using the platform.
4. Sisense
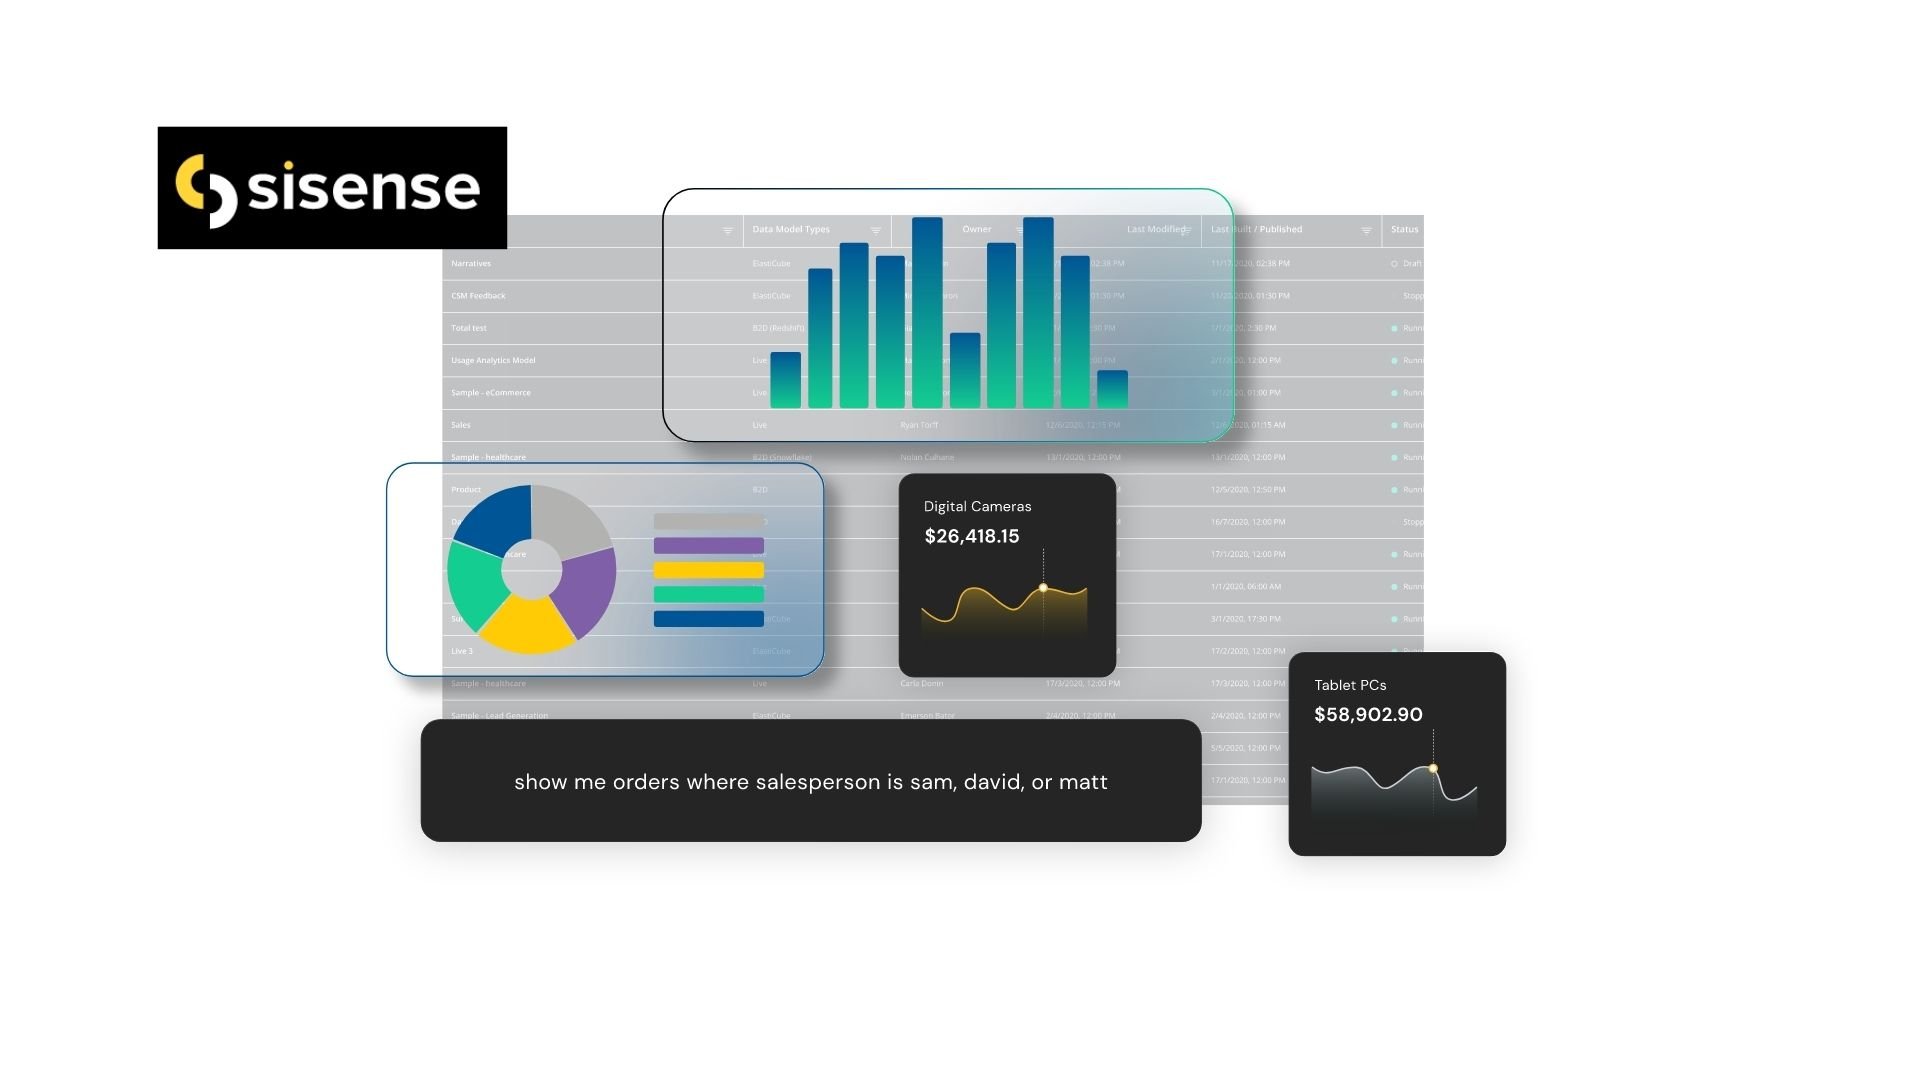 Sisense stands out from other offerings due its ability to handle large volumes of structured and unstructured data quickly and effectively thanks its proprietary In-Chip technology which has revolutionized how companies extract value from Big Data sets without needing expensive hardware investments or extensive coding knowhow. The software also boasts powerful yet intuitive dashboard building features enabling non technical personnel easily produce visually appealing reports tailored towards decision makers in an organization regardless if they are novice computer users or experienced analysts alike.
Sisense offers powerful analytics capabilities that enable users to quickly and easily build detailed reports and dashboards. It also has advanced data visualization features that allow users to create stunning visuals from their data. Additionally, Sisense makes it easy to access data from multiple sources in one place, allowing businesses to get real-time insights into their operations. Finally, its scalability and affordability make it an attractive solution for companies of all sizes.
Sisense: Best features
- 1. Easy-to-use drag and drop interface: Sisense's intuitive dashboard allows users to quickly create visualizations with its easy-to-use drag and drop interface, which makes data analysis a breeze.
- 2. Self-Service BI: Sisense enables users to easily analyze data without having to involve IT personnel in the process. This helps speed up time to insights and reduces costs associated with manually analyzing data.
- 3. Advanced analytics capabilities: Sisense provides advanced analytics capabilities such as predictive modeling, machine learning algorithms, natural language processing (NLP), and more that help businesses gain deeper insights into their data sets faster than ever before.
- 4. Automation & Scalability: With automated ETL processes and scalable cloud infrastructure, businesses can quickly scale up their operations without worrying about manual maintenance or expensive hardware investments for onsite solutions.
- 5. Real Time Insights: With real time insights from Sisense’s dashboards users can monitor business performance in near real time so they are always aware of what is happening in their organization at any given moment.
5. Tibco Spotfire
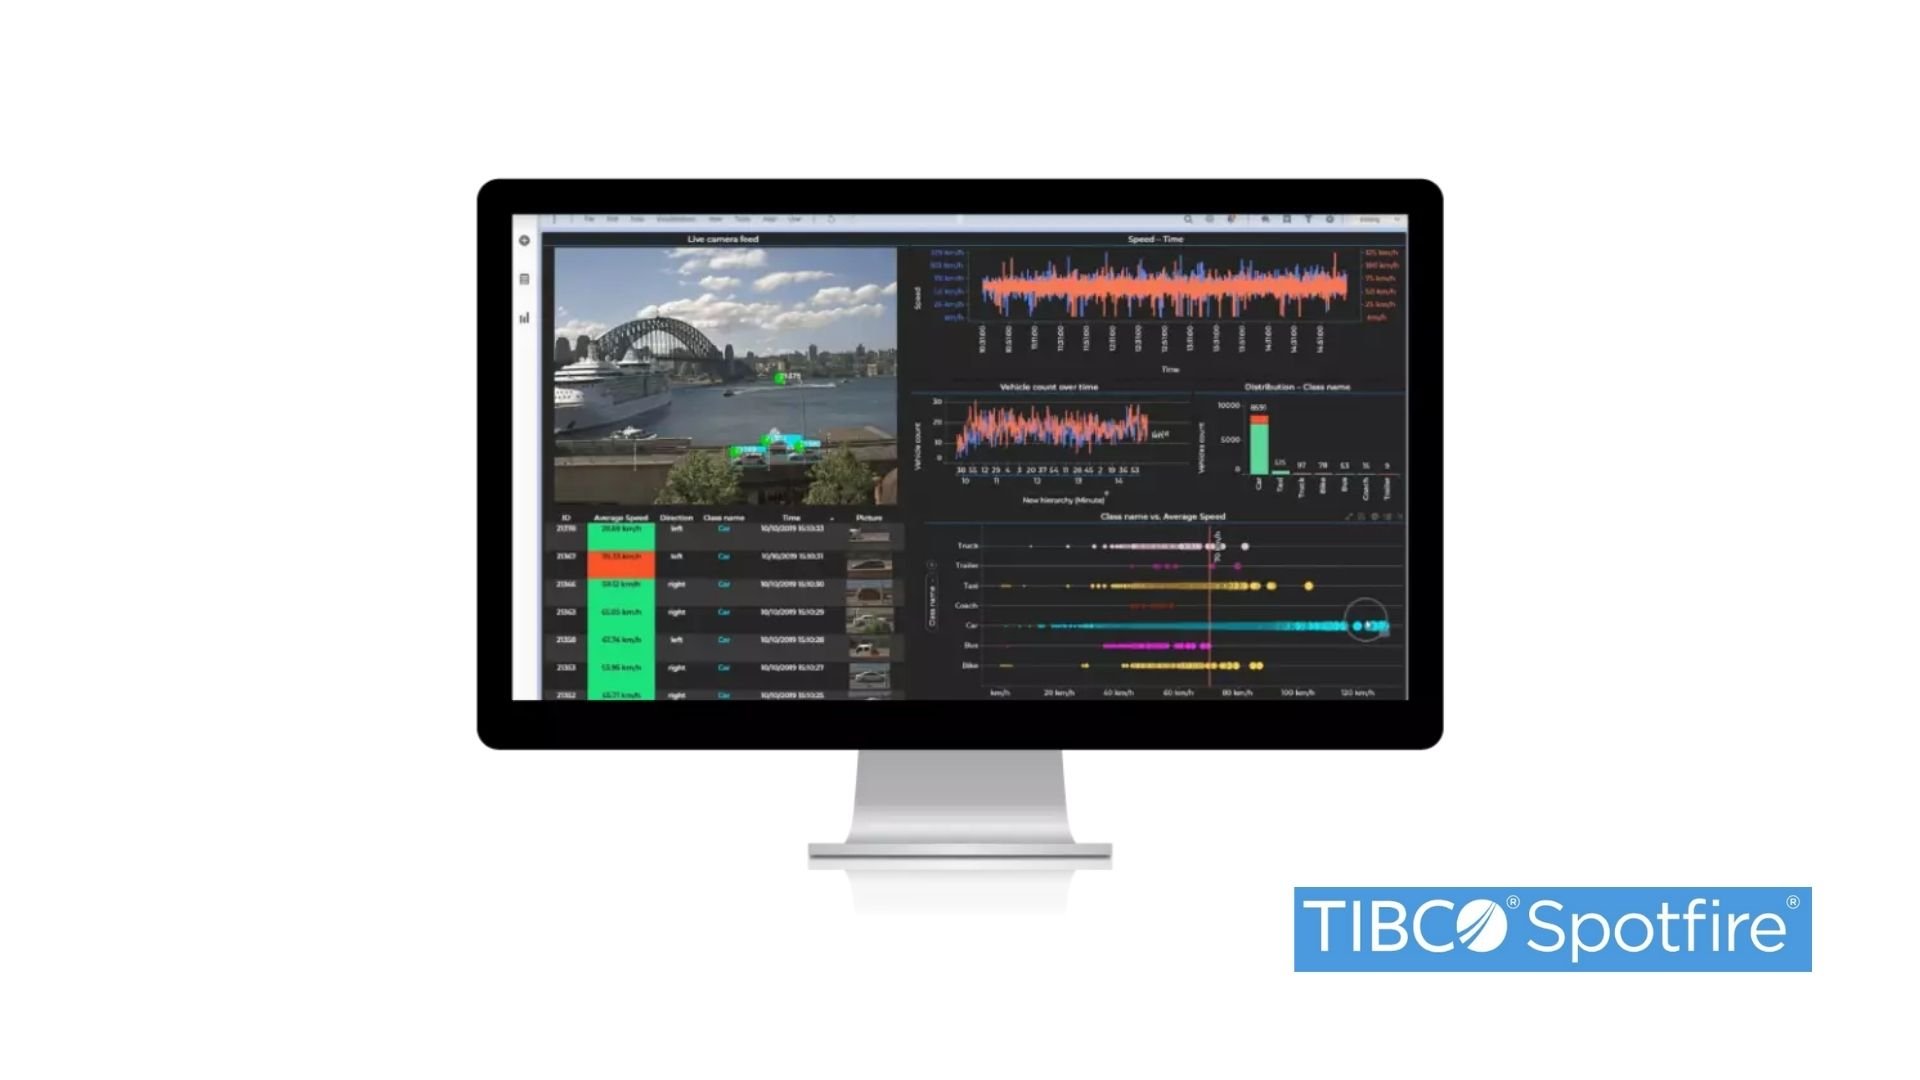 Tibco Spotfire boasts unparalleled speed when it comes crunching numbers combined with highly customizable visuals that enable end users interactively explore relationships between variables, correlations, outliers etc.; all within single integrated environment. Tibco eliminates the need to switch between separate apps every step way during analytical process. Additionally this product supports real-time streaming updates ensuring stakeholders always have access latest information possible order take effective actions accordingly.
Tibco's self-service dashboard allows users to quickly visualize data, while its predictive insights provide deeper insights into customer trends and behaviors. Tibco also offers advanced data visualization options, allowing users to create custom charts and graphs for in-depth analysis. Additionally, Tibco provides a comprehensive data security model that ensures sensitive information remains secure from unauthorized access or intrusion. Finally, Tibco’s scalability makes it an attractive choice for businesses of all sizes looking for a robust business intelligence solution.
Tibco: Best features
- 1. Robust and Flexible Architecture: Tibco provides a robust, flexible and scalable architecture that can be easily customized to meet the needs of any organization.
- 2. Comprehensive Integration Capabilities: Tibco offers comprehensive integration capabilities across multiple platforms, including cloud computing, web services, mobile applications, databases and more.
- 3. Enterprise-Grade Security: Tibco features enterprise-grade security features such as authentication, authorization and encryption to ensure data is kept secure at all times.
- 4. Ease of Use: With its intuitive graphical user interface (GUI), Tibco makes it easy for users to build complex integrations without requiring extensive coding skills or knowledge of programming languages such as Java or C++.
- 5. High Performance: The software is designed for high performance with low overhead so organizations can get maximum value from their IT investments in terms of time savings and cost efficiency.
Conclusion
Business intelligence tools have become a must-have tool for making data-driven decisions in the modern business world. Companies of all sizes are increasingly turning to these software solutions to make informed, evidence-based decisions that can help drive growth and profitability. As more organizations embrace digital transformation initiatives, the importance of using business intelligence (BI) tools is becoming even clearer.
Before you go...
Don't forget to download our guide with the 21 best reporting practices for Power BI. Optimize the performance of your Power BI reports with our practical tips.